Translate this page into:
Prevalence of blindness in India: A systematic review and meta-analysis
2 Dr Rajendra Prasad Centre for Ophthalmic Sciences, All India Institute of Medical Sciences, Ansari Nagar, New Delhi 110029, India
3 Department of Biostatistics, All India Institute of Medical Sciences, Ansari Nagar, New Delhi 110029, India
Corresponding Author:
Sumit Malhotra
Centre for Community Medicine, All India Institute of Medical Sciences, Ansari Nagar, New Delhi 110029
India
drsumitaiims2012@gmail.com
| How to cite this article: Malhotra S, Prasad M, Vashist P, Kalaivani M, Gupta SK. Prevalence of blindness in India: A systematic review and meta-analysis. Natl Med J India 2019;32:325-333 |
Abstract
Background. The National Programme for Control of Blindness and Visual Impairment modified the definition of blindness in 2017 in line with the internationally accepted definition. We did a systematic review and meta-analysis to compute pooled estimate of blindness in India among adults aged 50 years and above by using recent and old definitions of blindness.Methods. We retrieved population-based studies/surveys reporting the prevalence of blindness using recent (presenting vision <3/60 better eye) and previous (presenting vision <6/ 60 better eye) definitions in India during 1990–2017 from key search engines and grey literature. Two authors did an independent literature search and extracted relevant information. Pooled prevalence estimates were computed using Stata 12.0 by using the random effects model. Forest and funnel plots were generated. Stratification of results was also performed using two time periods: 1995–2005 and 2006–17.
Results. A total of 18 published articles/reports were included for recent and 20 for previous definitions of blindness, involving 211 502 participants. The pooled prevalence (95% confidence interval [CI]) obtained for recent and previous definitions of blindness in India was found to be 6.11% (5.07%–7.14%) and 9.91% (8.57%–11.25%), respectively. The stratified pooled prevalence (95% CI) from rapid surveys was 4.81% (3.26%–6.35%) and 4.68% (2.91%–6.46%) for studies published during 1995–2005 and 2006–17, respectively, using the new definition. The corresponding figures for comprehensive surveys were 9.22% (95% CI 6.48%–11.96%) for the period 1995–2005 and 3.81% (95% CI 2.76%–4.84%) for the period 2006–17.
Conclusion. There is a decrease in the prevalence of blindness in India using recent and previous definitions and a declining trend over time. High quantum of blindness remains an unfinished public health agenda for implementing programmes in larger populations to reduce its burden.
Introduction
Latest estimates suggest that there are 36 million people in the world who are blind (presenting visual acuity [PVA] <3/60 better eye) and that low- and middle-income countries, including India, have a disproportionately higher burden of blindness.[1] With 8 million blind people and 62 million visually impaired, India shares almost a quarter of the entire global burden of blindness and vision impairment.[2]
Blindness reduces productivity, quality of life and increases the risk of death.[3],[4],[5] The WHO in 2004 estimated that vision loss caused 3.9% of the total global burden of disease measured as disability-adjusted life years.[6] Among those who are blind or have moderate or severe vision impairment, 81% are aged 50 years and above.[1]
Estimating trends in the global burden of blindness and vision impairment is important for several reasons that include understanding areas of unmet needs and the effects of interventions such as cataract surgery. Data on the burden of blindness form an important basis for recommendations in public health policies, such as planning of national budgets and health services, and are important for scientific research.
In India, of late, the definition of blindness has been modified, and the National Programme for Control of Blindness and Visual Impairment in the Ministry of Health and Family Welfare have adopted the definition of blindness used by the WHO.[7] Now, the definition of blindness is visual acuity <3/60 in the better eye with available correction or PVA <3/60 in the better eye.[8] From the late 1970s till early 2017, the definition of blindness was visual acuity <6/60 in the better eye with available correction, or PVA <6/60 in the better eye (referred to as ‘previous definition’ hereafter in the paper); the prevalence of blindness in India showed an estimate that was much higher than that of other countries subscribing to the WHO definition (referred to as ‘recent definition’ hereafter in the paper) and precluded comparisons of prevalence and services.
We aimed to provide a pooled estimate of the prevalence of blindness in India among people aged 50 years and above, through a systematic review and meta-analysis, and to investigate factors influencing the estimate thus obtained.
Methods
The Preferred Reporting Items for Systematic reviews and Meta-Analyses (PRISMA)[9] and Meta-analysis of Observational Studies in Epidemiology (MOOSE) statements[10] were adhered to.
Inclusion criteria
The following criteria were used for eligibility of studies:
- Population-based studies/surveys
- Prevalence estimate reported in the age group of 50 years and above.
- Studies conducted in India
- Studies published between 1990 and 2017
- PVA measured according to the previous and/or recent definitions of blindness.[7],[8]
Editorials, letters, news, reviews, expert opinions, case report and studies without original data were excluded. If data were duplicated or shared in more than one journal, the study published later was included in the analysis.
Studies on specific disease groups (e.g. patients with leprosy or diabetes) and those reporting the prevalence of blindness only due to specific causes were excluded from the analysis.
The year 1990 was selected as the starting year for the search strategy as this was considered a watershed after which landmark policy decisions and resolutions to combat blindness were implemented.
Data sources and searches
PubMed, Web of Science, Google Scholar and TRIP (Turning Research into Practice) databases were searched up to December 2017 to identify all relevant studies. Keywords used were ‘prevalence’, ‘visual impairment’, ‘blindness’ and ‘India’. Reference lists of retrieved articles and pertinent reviews were also searched for relevant articles. No language restrictions were imposed.
Selection of studies
Titles and abstracts were screened in duplicate by two reviewers independently (SM and MP), and full texts of articles that either reviewer considered potentially eligible were obtained. The eligibility of articles was determined from the full texts. Similarly, data were abstracted by two reviewers independently and risk of bias was assessed using the CASP (Critical Appraisal Skills Programme) checklist.[11] During the phase of the review, it was planned to resolve the disagreement, if any, by discussion and, as necessary, in consultation with a third reviewer (PV/SKG).
Data extraction
The following data were extracted from each study: the first author's last name, publication year, region where the study was conducted, study period, rural or urban location, sample size, mean age of study participants, response rate and prevalence of blindness.
Data synthesis and statistical analysis
Pooled prevalence estimates were calculated using the random effects model using Stata 12.0 (StataCorp., College Station, Texas, USA), separately for recent and previous definitions for blindness considering studies published during 1990–2017, but during this period, the first study was published in 1997. The pooled prevalence was calculated for these two definitions stratified by the type of survey conducted (rapid/comprehensive). Stratified pooled prevalence was also calculated by segregating the year of publication into two strata, namely published during 1995–2005 and 2006–17 for recent definition of blindness. Forest plots were generated displaying prevalence with the corresponding 95% confidence interval (CI). The variation in the magnitude of the effect was examined and heterogeneity was quantified using I2 statistic. The funnel plot was used to detect potential reporting bias and small study effects. The Egger method was used to assess asymmetry. Sensitivity analysis was carried out to investigate the effect of two studies which had extremely large prevalence.
To investigate the heterogeneity observed, meta-regression was done for independent variables, namely rural/urban residence, sample size, state in which the study was conducted and year of publication.
Results
Study selection
[Figure - 1] depicts the process of identifying eligible studies and citations through searches in electronic databases. The title and abstract of 56 full texts were assessed, of which 19 publications in various journals were included.[12],[13],[14],[15],[16],[17],[18],[19],[20],[21],[22],[23],[24],[25],[26],[27],[28],[29],[30] The final sample of studies yielded a total of 211 502 participants. One of the published studies reported two estimates which were for two different periods[22] and four published reports were also included in the review.[31],[32],[33],[34] The four reports are included at the end of the tables. For the recent definition of blindness, 16 papers and reports provided relevant data and contributed to the pooled estimate. For the previous definition of blindness, the corresponding number was 18. There was complete inter-observer agreement for the full-text screening. Authors of two studies were contacted, neither of them supplied us the requested data.
![[Figure - 1]](#fig_NatlMedJIndia_2019_32_6_325_303612_f1.jpg)
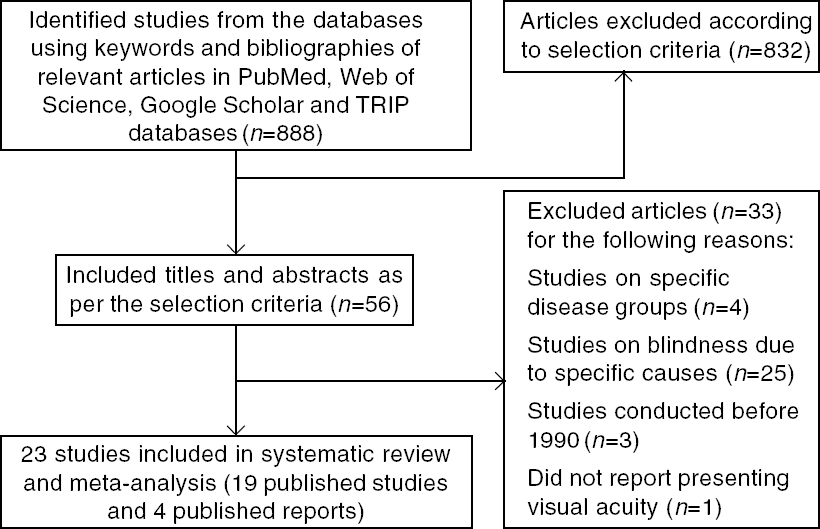 |
| Figure 1: Preferred reporting items for systematic reviews and meta-analyses (PRISMA) flow chart for selection of studies TRIP (Turning Research into Practice) |
Study characteristics
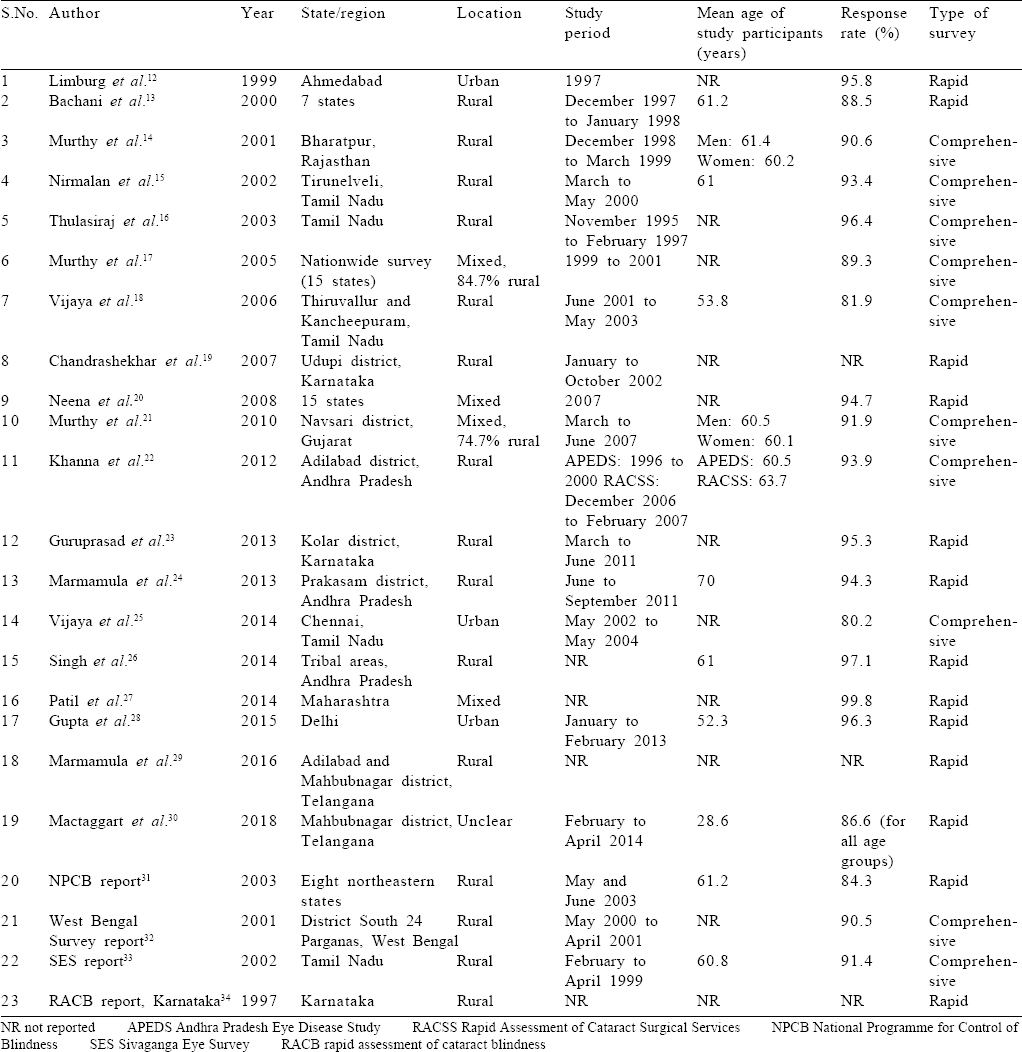
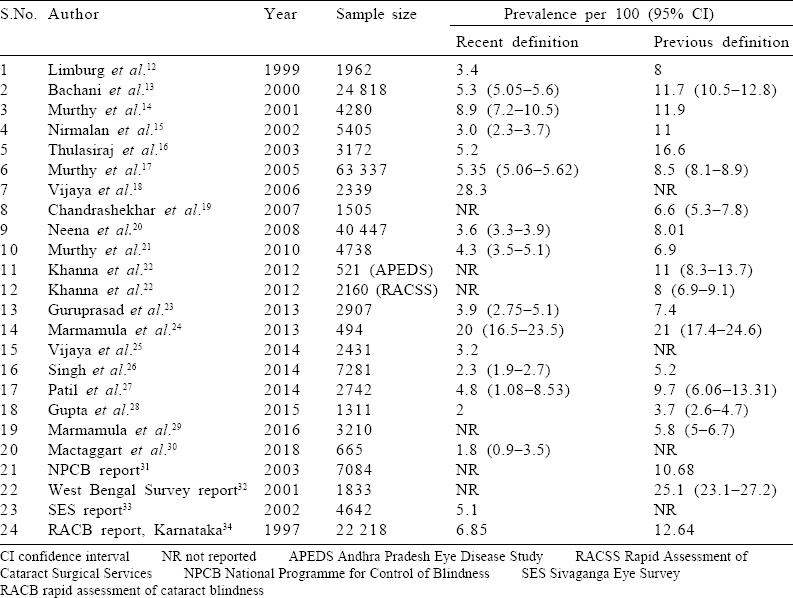
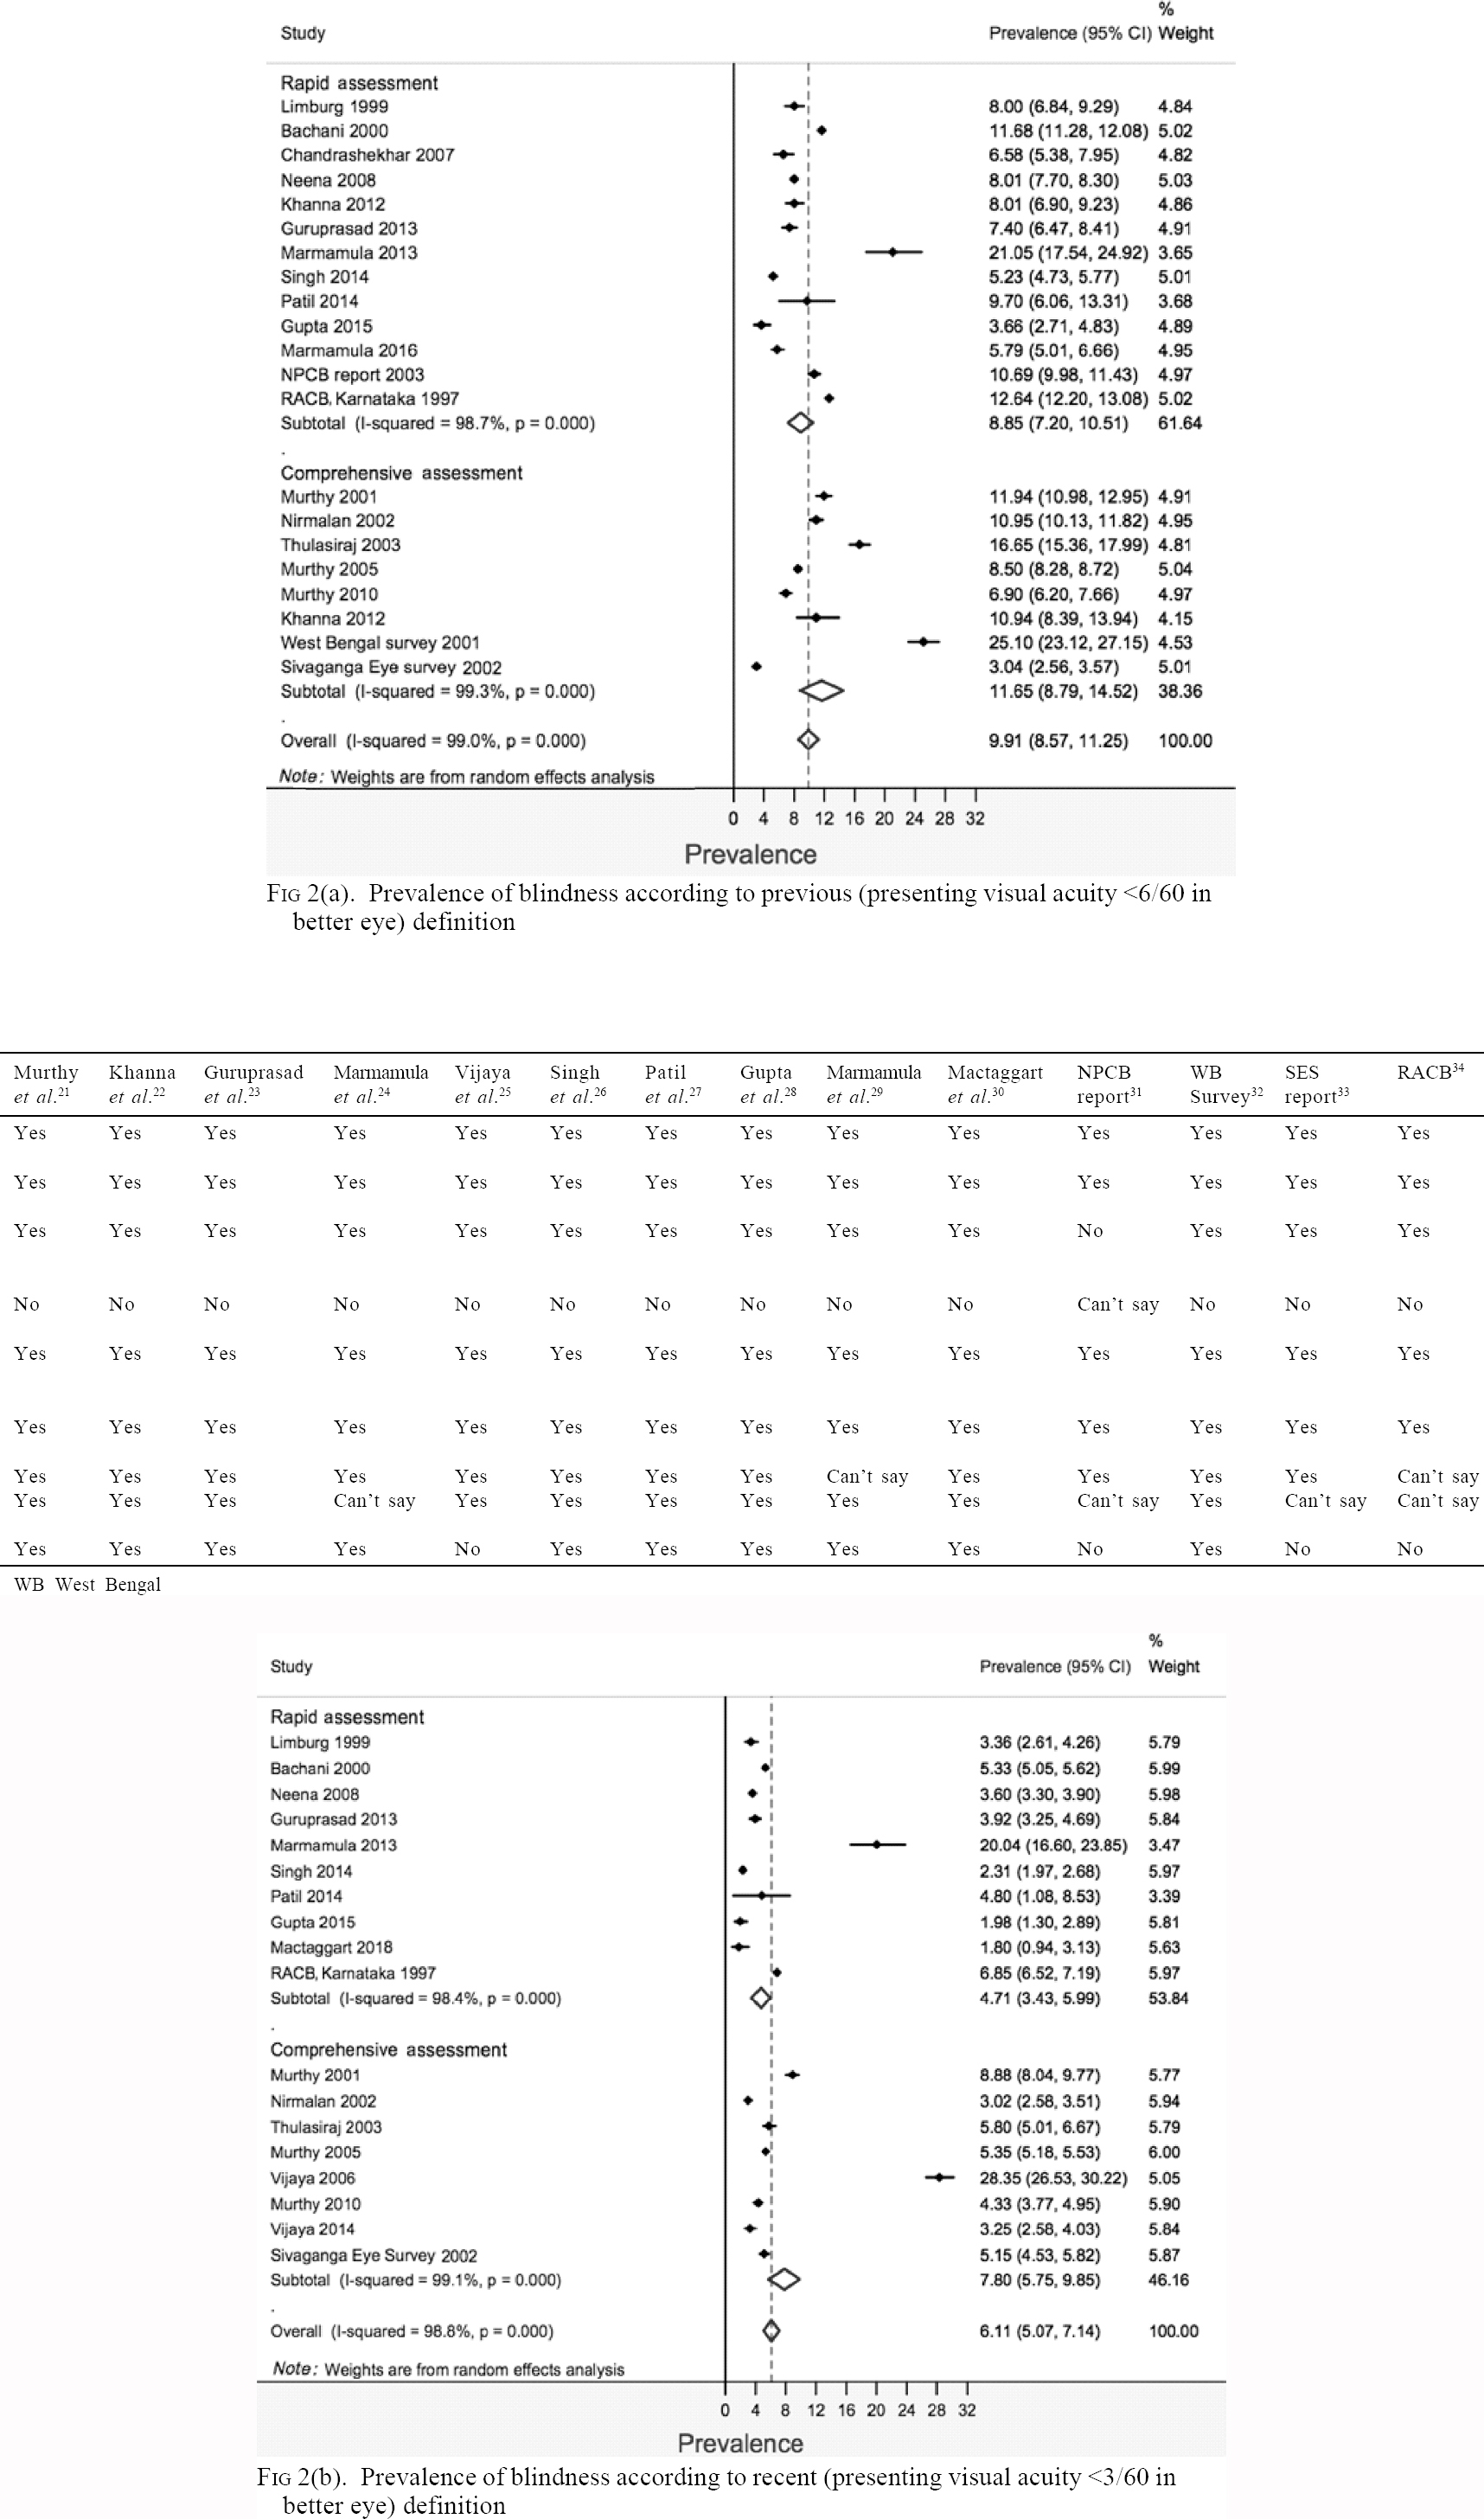
[Table - 1] shows the study characteristics and [Table - 2] has the reported blindness estimates for the included studies. Most of the studies were conducted in southern India, particularly in rural areas. The mean age of the study participants ranged from 53.8 to 70 years. The response rate was satisfactory in all studies that reported it. The prevalence of blindness according to the recent definition was 2%–28.3% and that according to previous definitions was 4%–25%.
![[Table - 1]](#tbl_NatlMedJIndia_2019_32_6_325_303612_t6.jpg)
![[Table - 2]](#tbl_NatlMedJIndia_2019_32_6_325_303612_t7.jpg)
Risk of bias assessment
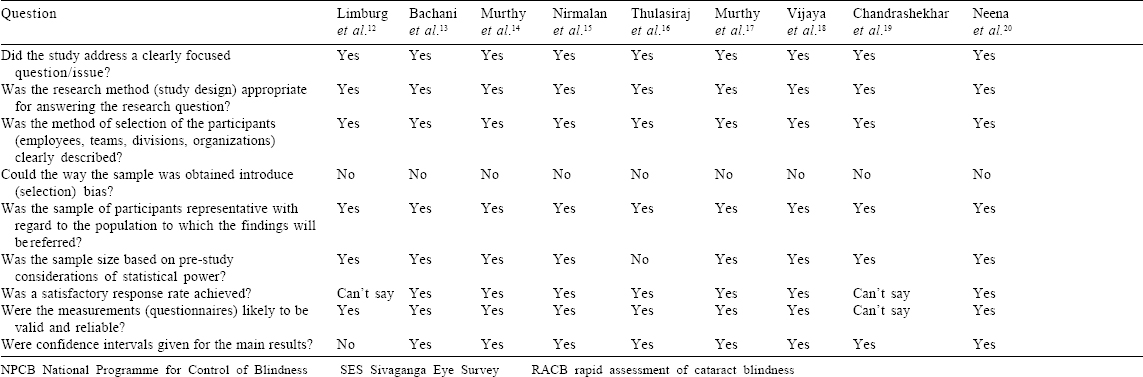
[Table - 3] depicts the risk of bias in the included studies. All but one study clearly mentioned a sampling methodology keeping them at low risk of selection bias. All but one study calculated a minimum sample size a priori. Apart from four studies, all reported a satisfactory response rate ranging from 80.2% to 96.3%. CIs for estimates were mentioned by 15 of 17 published studies. Only one published report among the four mentioned the CI along with the point estimate.
![[Table - 3]](#tbl_NatlMedJIndia_2019_32_6_325_303612_t8.jpg)
Estimate for the prevalence of blindness in India
The overall pooled prevalence (95% CI) obtained for previous and recent definitions of blindness was 9.91% (8.57%–11.25%) and 6.11% (5.07%–7.14%), respectively [Figure - 2]a and [Figure - 2]b. For the previous definition of blindness, the pooled prevalence (95% CI) of blindness for rapid and comprehensive types of surveys was 8.85% (7.2%–10.51%) and 11.65% (8.79%–14.52%), respectively. For the recent definition of blindness, the pooled prevalence (95% CI) of blindness for rapid and comprehensive types of surveys, respectively, was 4.71% (3.43%–5.99%) and 7.8% (5.75%–9.85%). The heterogeneity (I2) between studies by both the definitions of blindness was considerably high. Most estimates were fairly precise and had overlapping CIs.
![[Figure - 2]](#fig_NatlMedJIndia_2019_32_6_325_303612_f2.jpg)
 |
| Figure 2: |
The stratified pooled prevalence was 4.81% (95% CI 3.26%– 6.35%) and 4.68% (95% CI 2.91%–6.46%) for studies published during 1995–2005 and 2006–17, respectively, for rapid surveys [Figure - 3]. The corresponding figures for comprehensive surveys were 9.22% (95% CI 6.48%–11.96%) for the period 1995–2005 and 3.81% (95% CI 2.76%–4.84%) for the period 2006–17, respectively. There were two studies having extremely high prevalence (>20) in both the strata of year of publication, and sensitivity analysis was carried out excluding these studies. After excluding, the pooled prevalence (95% CI) was 3.74% (2.50%–4.980%) and 5.08% (3.99%–6.17%) for rapid and comprehensive surveys, respectively [Figure - 4].
![[Figure - 3]](#fig_NatlMedJIndia_2019_32_6_325_303612_f3.jpg)
![[Figure - 4]](#fig_NatlMedJIndia_2019_32_6_325_303612_f4.jpg)
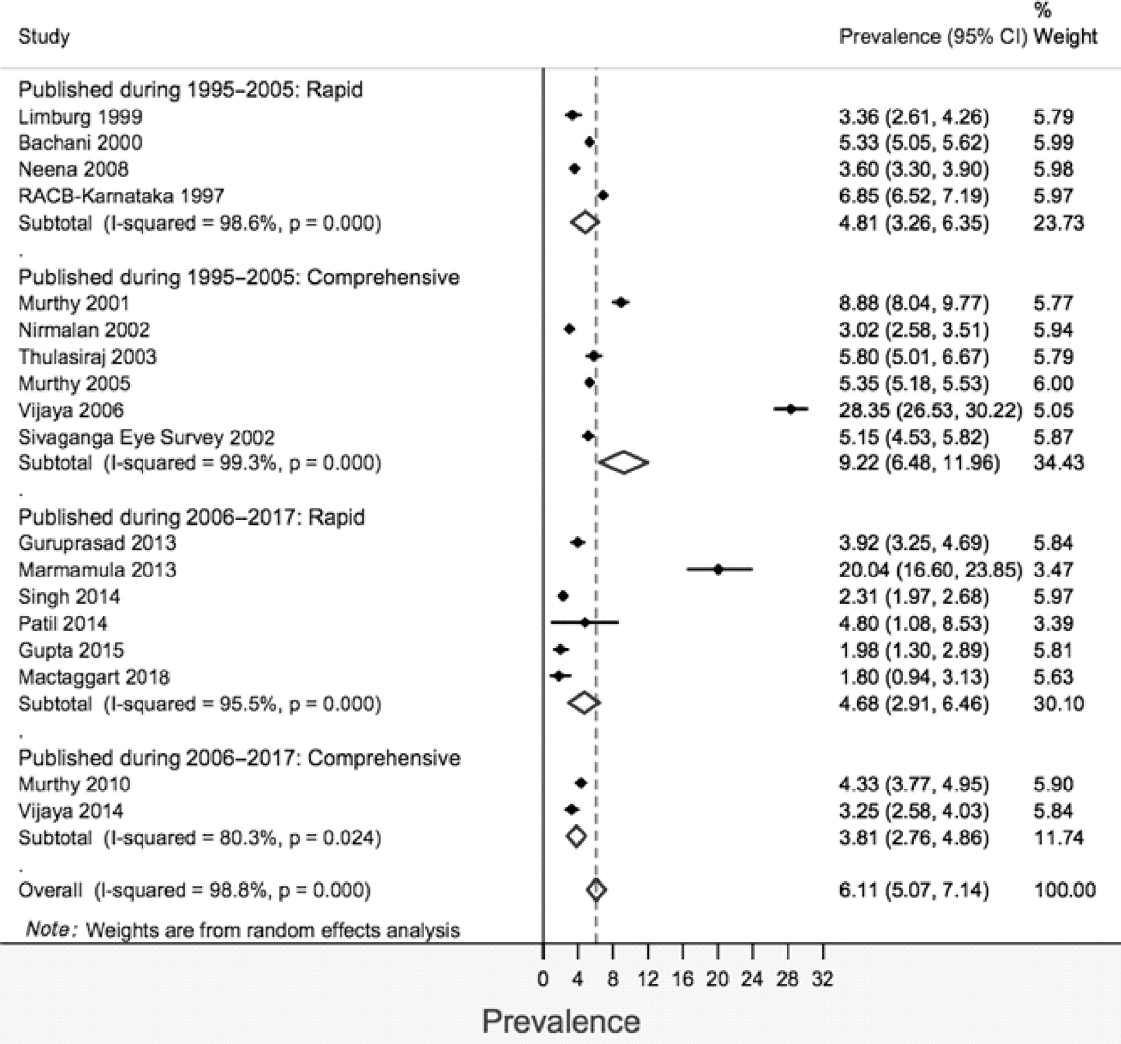 |
| Figure 3: Prevalence of blindness according to recent (presenting visual acuity <3/60 in better eye) definition grouped by the year of publication |
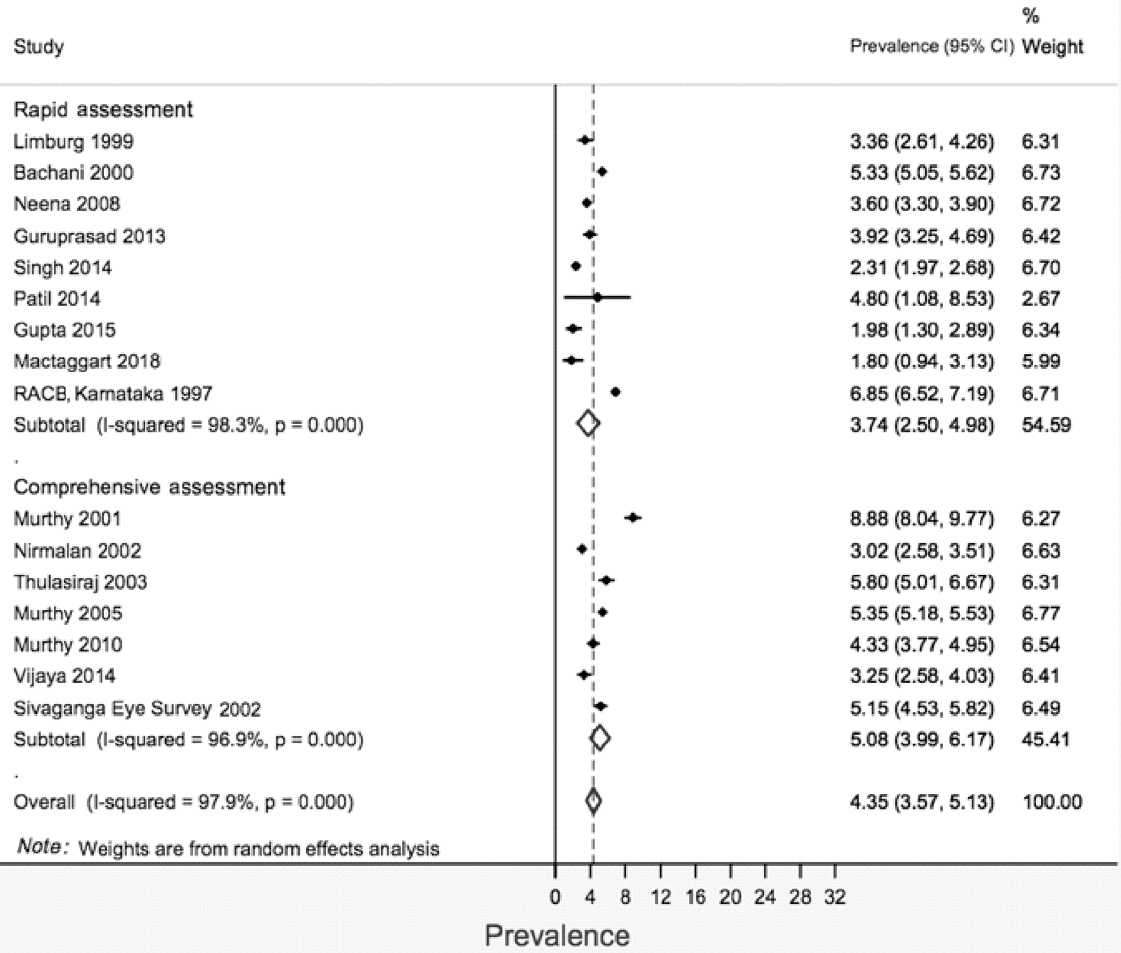 |
| Figure 4: Prevalence of blindness according to recent (presenting visual acuity <3/60 in better eye) definition, after excluding studies with prevalance >20 |
There was asymmetry in the funnel plots [Figure - 5] due to two studies which were far from the remaining studies and this bias may be due to methodological quality of smaller studies biased towards larger beneficial effects.
![[Figure - 5]](#fig_NatlMedJIndia_2019_32_6_325_303612_f5.jpg)
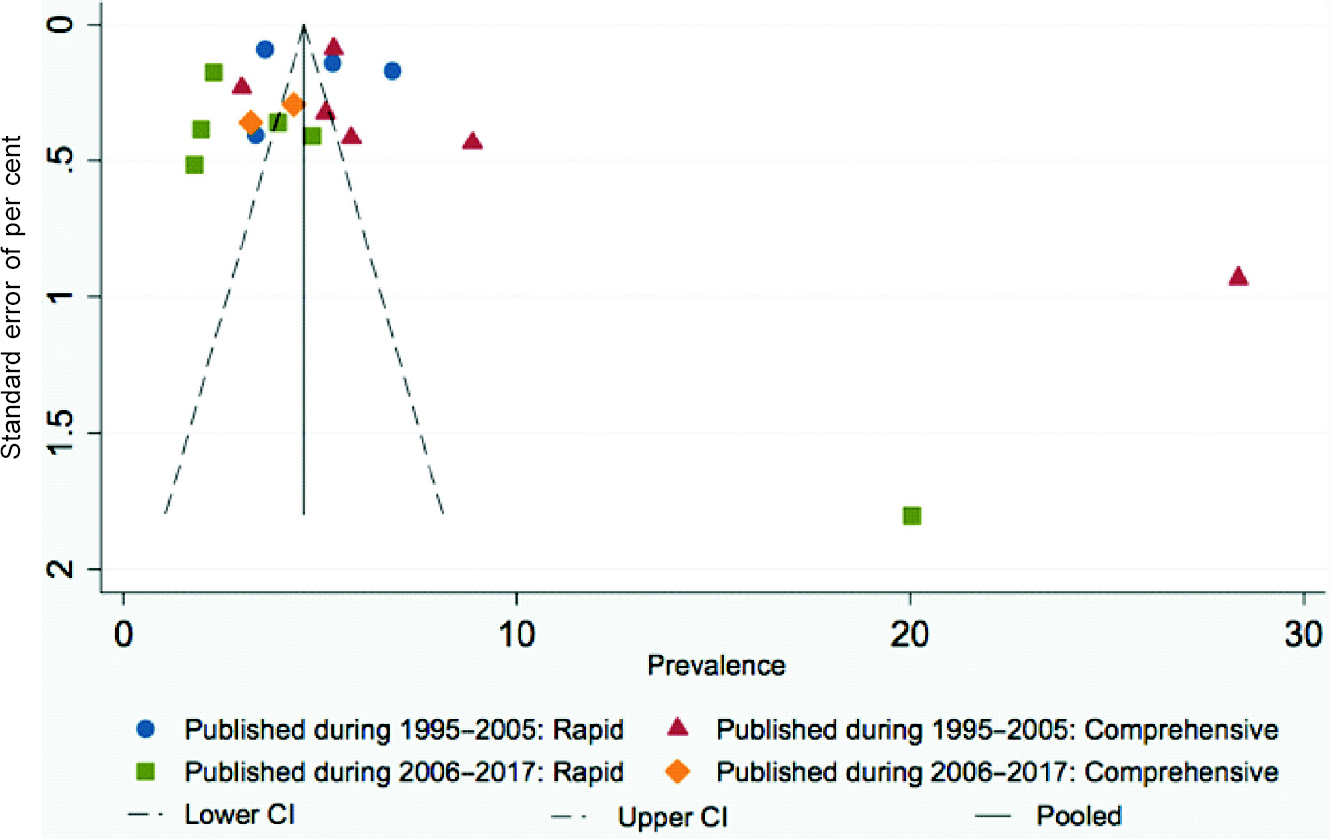 |
| Figure 5: Funnel plot showing prevalence of blindness according to recent (presenting visual acuity <3/60 in better eye) definition grouped by the years of publication |
Investigation of heterogeneity
There was a high level of heterogeneity in the meta-analysis (I2 98.8%). On exclusion of the two studies with the outlying estimates from the analysis, the I2 statistic did not change (I2 97.9).[18],[24] Heterogeneity remained on stratification by year of publication and type of survey. Further, meta-regression analysis was done to identify the sources of between-study heterogeneity in the pooled prevalence estimates considering the sample size, rural location, state of study and year of publication, and none of the variables were statistically significant (results not shown).
Discussion
Our study updates the estimates of the prevalence of blindness among those over 50 years of age in India according to the new definition adopted by the Ministry of Health and Family Welfare. The prevalence of blindness was 6.11% with a 95% CI of 5.07%–7.14%. This estimate is based on PVA and thus provides a more actionable target for resource-constrained regions.
The comparison of pooled prevalence from studies before and after 2005 shows a decrease for both rapid and comprehensive surveys, which is a favourable trend. One of the factors contributing to the declining trend could be an increase in the rate of cataract surgery in India over the years as cataract is the most common cause of blindness in India. Continuing measures to arrest the causes of blindness should be accompanied by meticulous planning and careful implementation. The variation in the estimates from individual studies is possibly due to heterogeneity in the study population and methodology. The estimate is expected to vary largely by region and year of data collection.
It is pertinent for the prevalence of blindness in India to be compared with other Southeast Asian countries and low- and middle-income countries; however, such comparisons may be difficult because of different age groups sampled. A nationwide survey on 16 507 individuals in Pakistan reported the prevalence of blindness to be 2.7% in individuals aged 30 years and above.[35] However, the prevalence reported in the age group similar to the studies in the present review (>50 years) was 7%. In Nepal, the prevalence of blindness in patients >45 years was estimated to be 5.3%.[36] On the other hand, a nationwide survey of over 18 000 individuals in Malaysia estimated the prevalence of blindness to be 4.7% in those ≥70 years of age.[37] A study in Oman on 11 417 individuals revealed the prevalence of blindness to be 16.8% for those >60 years and 2.3% for those aged 40–59 years.[38] A study in Sudan on 2488 individuals reported a prevalence of 20.7% in those >50 years.[39]
The Vision Loss Expert Group reported that 54% of 324 million blind people and 71% of 191 million people with moderate or severe vision impairment in 2010 were attributed to cataract and uncorrected refractive error, respectively.[40] The effect of interventions on avoidable blindness and the progress made towards achieving the targets over 2010–15 are therefore important to assess with up-to-date and accurate data.
Flaxman et al. from the Vision Loss Expert Group presented the causes of blindness and distance vision impairment in adults aged 50 years or older in all 21 regions of the world in 2015, described the trends from 1990 to 2015 using an updated Global Vision Database and made projections of avoidable vision loss prevalence to 2020.[41] The top three causes of blindness worldwide were cataract, uncorrected refractive error and glaucoma. In adults aged 50 years or older, 55% of blindness and 77% of moderate or severe vision impairment were contributed by cataract and uncorrected refractive error, respectively. Moreover, they projected an increase in the number of people with avoidable vision impairment to 2020, mainly driven by South Asia and East Asia. Obtaining a precise estimate of the quantum of blindness in India is imperative for calling on urgent action for this largely preventable problem.
Our study has several strengths. It incorporates a rigorous search strategy of important sources of data, including published and grey literature. Risk of bias assessment enables a judgement of the validity of the estimates that contributes to the pooled effect size. The data were explored extensively through both the random and fixed effects models, as well as meta-regression techniques for the investigation of heterogeneity. This is possibly the first study reporting the prevalence of blindness according to previous and recent Indian definitions. The pooled estimate is obtained from a large sample, yielding high precision.
Limitations of our study include a high level of observed heterogeneity, which could not be explained by either exclusion of studies with outlying estimates or by meta-regression of independent variables on the univariable model.
This study should be followed by an assessment of cause-specific prevalence of blindness and vision impairment, to enable policy-makers to guide allocation of resources and plan health services. There is a need for standardization of the definition of blindness and vision impairment and more nationally representative surveys than have been done so far for comparison with international studies and worldwide reporting.
Conflicts of interest. None declared
| 1. | Bourne RR, Flaxman SR, Braithwaite T, Cicinelli MV, Das A, Jonas JB, et al. Magnitude, temporal trends, and projections of the global prevalence of blindness and distance and near vision impairment: A systematic review and meta-analysis. Lancet Glob Health 2017;5:e888–97. [Google Scholar] |
| 2. | Stevens GA, White RA, Flaxman SR, Price H, Jonas JB, Keeffe J, et al. Global prevalence of vision impairment and blindness: Magnitude and temporal trends, 1990–2010. Ophthalmology 2013;120:2377–84. [Google Scholar] |
| 3. | Shamanna BR, Dandona L, Rao GN. Economic burden of blindness in India. Indian J Ophthalmol 1998;46:169–72. [Google Scholar] |
| 4. | Taipale J, Mikhailova A, Ojamo M, Nättinen J, Väätäinen S, Gissler M, et al. Low vision status and declining vision decrease Health-Related Quality of Life: Results from a nationwide 11-year follow-up study. Qual Life Res 2019;28: 3225–6. [Google Scholar] |
| 5. | McCarty CA, Nanjan MB, Taylor HR. Vision impairment predicts 5 year mortality. Br J Ophthalmol 2001;85:3221–94. [Google Scholar] |
| 6. | Rodgers A, Ezzati M, Vander Hoorn S, Lopez AD, Lin RB, Murray CJ, et al. Distribution of major health risks: Findings from the Global Burden of Disease study. PLoS Med 2004;1:e27. [Google Scholar] |
| 7. | Vashist P, Senjam SS, Gupta V, Gupta N, Kumar A. Definition of blindness under National Programme for Control of Blindness: Do we need to revise it? Indian J Ophthalmol 2017;65:92–6. [Google Scholar] |
| 8. | Change the Definition of Blindness. Available at www.who.int/blindness/Change %20the%20Definition%20of%20Blindness.pdf (accessed on 4 Jan 2018). [Google Scholar] |
| 9. | Moher D, Shamseer L, Clarke M, Ghersi D, Liberati A, Petticrew M, et al. Preferred Reporting Items for Systematic Review and Meta-analysis protocols (PRISMA-P) 2015 statement. Syst Rev 2015;4:1. [Google Scholar] |
| 10. | Stroup DF, Berlin JA, Morton SC, Olkin I, Williamson GD, Rennie D, et al Meta-analysis of observational studies in epidemiology: A proposal for reporting. Meta-analysis of Observational Studies in Epidemiology (MOOSE) group. JAMA 2000;283:2008–12. [Google Scholar] |
| 11. | CASP Critical Appraisal Skills Programme Oxford UK. Critical Appraisal Skills Programme. Available at www.casp-uk.net (accessed on 4 Jan 2018). [Google Scholar] |
| 12. | Limburg H, Vasavada AR, Muzumdar G, Khan MY, Vaidyanathan K, Trivedi R, et al. Rapid assessment of cataract blindness in an urban district of Gujarat. Indian J Ophthalmol 1999;47:135–41 (accessed on 5 Jan 2018). [Google Scholar] |
| 13. | Bachani D, Murthy GV, Gupta KS. Rapid assessment of cataract blindness in India. Indian J Public Health 2000;44:8200–9. [Google Scholar] |
| 14. | Murthy GV, Ellwein LB, Gupta S, Tanikachalam K, Ray M, Dada VK, et al. A population-based eye survey of older adults in a rural district of Rajasthan: II. Outcomes of cataract surgery. Ophthalmology 2001;108:6861–92. [Google Scholar] |
| 15. | Nirmalan PK, Thulasiraj RD, Maneksha V, Rahmathullah R, Ramakrishnan R, Padmavathi A, et al. A population based eye survey of older adults in Tirunelveli district of South India: Blindness, cataract surgery, and visual outcomes. Br J Ophthalmol 2002;86:5052–12. [Google Scholar] |
| 16. | Thulasiraj RD, Nirmalan PK, Ramakrishnan R, Krishnadas R, Manimekalai TK, Baburajan NP, et al. Blindness and vision impairment in a rural South Indian population: The Aravind Comprehensive Eye Survey. Ophthalmology 2003;110: 1491–8. [Google Scholar] |
| 17. | Murthy GV, Gupta SK, Bachani D, Jose R, John N. Current estimates of blindness in India. Br J Ophthalmol 2005;89:257–60. [Google Scholar] |
| 18. | Vijaya L, George R, Arvind H, Baskaran M, Raju P, Ramesh SV, et al. Prevalence and causes of blindness in the rural population of the Chennai Glaucoma Study. Br J Ophthalmol 2006;90:407–10. [Google Scholar] |
| 19. | Chandrashekhar TS, Bhat HV, Pai RP, Nair SK. Prevalence of blindness and its causes among those aged 50 years and above in rural Karnataka, South India. Trop Doct 2007;37:18–21. [Google Scholar] |
| 20. | Neena J, Rachel J, Praveen V, Murthy GV, Rapid Assessment of Avoidable Blindness India Study Group. Rapid assessment of avoidable blindness in India. PLoS One 2008;3:e2867. [Google Scholar] |
| 21. | Murthy GV, Vashist P, John N, Pokharel G, Ellwein LB. Prevalence and causes of visual impairment and blindness in older adults in an area of India with a high cataract surgical rate. Ophthalmic Epidemiol 2010;17:185–95. [Google Scholar] |
| 22. | Khanna RC, Marmamula S, Krishnaiah S, Giridhar P, Chakrabarti S, Rao GN, et al. Changing trends in the prevalence of blindness and visual impairment in a rural district of India: Systematic observations over a decade. Indian J Ophthalmol 2012;60:492–7. [Google Scholar] |
| 23. | Guruprasad BS, Krishnamurthy D, Narendra DP, Ranganath BG, Shamanna RB. Changing scenario of cataract blindness in Kolar district, Karnataka, South India. The utility of rapid assessment of avoidable blindness in reviewing programs. Ophthalmic Epidemiol 2013;20:89–95. [Google Scholar] |
| 24. | Marmamula S, Ravuri CS, Boon MY, Khanna RC. A cross-sectional study of visual impairment in elderly population in residential care in the South Indian state of Andhra Pradesh: A cross-sectional study. BMJ Open 2013;3:e002576. [Google Scholar] |
| 25. | Vijaya L, George R, Asokan R, Velumuri L, Ramesh SV. Prevalence and causes of low vision and blindness in an urban population: The Chennai Glaucoma Study. Indian J Ophthalmol 2014;62:477–81. [Google Scholar] |
| 26. | Singh N, Eeda SS, Gudapati BK, Reddy S, Kanade P, Shantha GP, et al. Prevalence and causes of blindness and visual impairment and their associated risk factors, in three tribal areas of Andhra Pradesh, India. PLoS One 2014;9:e100644. [Google Scholar] |
| 27. | Patil S, Gogate P, Vora S, Ainapure S, Hingane RN, Kulkarni AN, et al. Prevalence, causes of blindness, visual impairment and cataract surgical services in Sindhudurg district on the western coastal strip of India. Indian J Ophthalmol 2014;62: 240–5. [Google Scholar] |
| 28. | Gupta N, Vashist P, Malhotra S, Senjam SS, Misra V, Bhardwaj A, et al. Rapid assessment of visual impairment in urban population of Delhi, India. PLoS One 2015;10:e0124206. [Google Scholar] |
| 29. | Marmamula S, Khanna RC, Kunkunu E, Rao GN. Population-based assessment of prevalence and causes of visual impairment in the state of Telangana, India: A cross-sectional study using the Rapid Assessment of Visual Impairment (RAVI) methodology. BMJ Open 2016;6:e012617. [Google Scholar] |
| 30. | Mactaggart I, Polack S, Murthy G, Kuper H. A population-based survey of visual impairment and its correlates in Mahabubnagar district, Telangana state, India. Ophthalmic Epidemiol 2018;25:238–45. [Google Scholar] |
| 31. | National Programme for Control of Blindness. Rapid assessment of blindness in north eastern states of India. New Delhi:Ministry of Health and Family Welfare; 2003. Report. [Google Scholar] |
| 32. | The Prevalence of Cataract Blindness and Surgical Visual Outcome in a Population Based Survey in the District South 24 Parganas, West Bengal. District Blindness Control Society, South 24 Parganas, West Bengal, Regional Institute of Ophthalmology, Medical College, Calcutta, Institute of Ophthalmology, London;2001. Report. [Google Scholar] |
| 33. | Cataract Blindness and Surgical Outcomes Survey, Sivaganga, Tamilnadu. Madurai:Lions Aravind Eye Institute of Community Ophthalmology, Aravind Eye Hospital, Madurai; 2002. Report. [Google Scholar] |
| 34. | Rapid Assessment of Cataract Blindness, Karnataka. Danish Assistance to the National Programme for Control of Blindness, New Delhi. February, 1997. Report. [Google Scholar] |
| 35. | Jadoon MZ, Dineen B, Bourne RR, Shah SP, Khan MA, Johnson GJ, et al. Prevalence of blindness and visual impairment in Pakistan: The Pakistan National Blindness and Visual Impairment Survey. Invest Ophthalmol Vis Sci 2006;47:4749–55. [Google Scholar] |
| 36. | Pokharel GP, Regmi G, Shreshtha SK, Negrel AD, Ellwein LB. Prevalence of blindness and cataract surgery in Nepal. Br J Ophthalmol 1998;82:600–5. [Google Scholar] |
| 37. | Zainal M, Ismail SM, Ropilah AR, Elias H, Arumugam G, Alias D, et al. Prevalence of blindness and low vision in Malaysian population: Results from the National Eye Survey 1996. Br J Ophthalmol 2002;86:951–6. [Google Scholar] |
| 38. | Khandekar R, Mohammed AJ, Negrel AD, Riyami AA. The prevalence and causes of blindness in the Sultanate of Oman: The Oman Eye Study (OES). Br J Ophthalmol 2002;86:957–62. [Google Scholar] |
| 39. | Ngondi J, Ole-Sempele F, Onsarigo A, Matende I, Baba S, Reacher M, et al. Prevalence and causes of blindness and low vision in Southern Sudan. PLoS Med 2006;3:e477. [Google Scholar] |
| 40. | Bourne RR, Stevens GA, White RA, Smith JL, Flaxman SR, Price H, et al. Causes of vision loss worldwide, 1990–2010: A systematic analysis. Lancet Glob Health 2013;1:e339–49. [Google Scholar] |
| 41. | Flaxman SR, Bourne RR, Resnikoff S, Ackland P, Braithwaite T, Cicinelli MV, et al. Global causes of blindness and distance vision impairment 1990–2020: A systematic review and meta-analysis. Lancet Glob Health 2017;5:e1221–34. [Google Scholar] |
Fulltext Views
4,397
PDF downloads
365