Translate this page into:
Assessment of food safety and hygiene practices of street food vending units in urban and semi-urban areas of Puducherry
Correspondence to PRASANNA THIRUNAVUKKARASU; drprasanmail@gmail.com
[To cite: Loganathan V, Thirunavukkarasu P, Muthukrishnan V, Dhanuskodi T. Assessment of food safety and hygiene practices of street food vending units in urban and semi-urban areas of Puducherry. Natl Med J India 2024;37:311–14. DOI: 10.25259/NMJI_793_2022]
Abstract
Background
We aimed to assess the food safety and hygiene practices at street food vending units (SFVUs) in urban and semi-urban areas of Puducherry.
Methods
We did an observational assessment in two areas of Puducherry. We did a walk-through mapping and enumeration to identify active SFVUs. Later, through discrete non-participatory observations, we recorded various physical, environmental, food handling, vending and behavioural aspects involved in street food vending using a checklist. This was done at an optimal distance from the SFVUs, without the knowledge of the vendor.
Results
Of the 115 SFVUs enumerated, 102 units were active during observation visits; 52 in Lawspet (urban) and 50 in Villianur (semi-urban). None of these units displayed the licence or certification required under India’s Food Safety and Standards Act. Only 29 (28.3%) of the units had dedicated handwashing facilities, and 50 (49%) had dustbins. All the units had separated raw foods from cooked foods. Other key characteristics such as maintenance of appropriate temperature to preserve foods, appropriate packaging materials, and cleaning methods, were less than satisfactory. Vendors involved in frequent unhygienic behaviours and practices, including frequent contact with food being served, body parts, cash and utensils, but in relatively fewer healthy behaviours such as handwashing or cleaning.
Conclusion
Street food vending and consumption were common and of unsatisfactory standards in urban and semi-urban parts of Puducherry.
INTRODUCTION
Unsafe and unhygienic foods are estimated to cause around 400 000 global deaths annually and are considered an important public health risk, hindering overall socio-economic development.1 Street foods are integral to urban culture, preferred and consumed by millions of people of diverse social strata globally and in India. Food handlers play a crucial role in protecting the health of consumers by adopting basic hygienic practices when buying, selling and preparing food.2,3 Various studies have examined multiple aspects of street food vending in India, such as socioeconomics, safety and quality of street foods.4–11
Although there are several food safety-related legislations in India, very few studies assessed the implementation of these practices.12,13 There is a need to comprehensively study various aspects of street food vending and to capture local practices. We did this study to enumerate the street food vending units (SFVUs) and study, through observation, the food safety and hygiene aspects of these units in select urban and semi-urban areas in Puducherry, India.
METHODS
The study was done in two areas in Puducherry: Lawspet, a densely populated ward of Oulgaret Municipality with a population of around 90 000 and Villianur, a semi-urban Census Town with a population of about 35 000. The land area of Lawspet and Villianur is ~3.88 km2 and ~16 km2, respectively.14,15
Initially, we did a walk-through survey, enumerated all the SFVUs, and observed various local street food vending practices. A SFVU was defined as one engaged in vending food items to the general public in a street, lane, sidewalk, footpath, pavement, public park or any other public place or private area, from a temporary built up structure or by moving from place to place.16 Enumeration was done on 3 different days in a week (including a Sunday) in two instances (morning and evening hours) in both areas. All SFVUs identified during the enumeration survey were later visited to observe food safety and hygiene practices in detail.
A comprehensive checklist was developed to capture the physical, environmental, food handling, vending practices, and behavioural aspects of vendors and consumers.17–20 Food safety and hygiene parameters were adapted from the Food Safety Standards Authority of India (FSSAI) and WHO documents.17 Each unit was observed from an optimal distance (about 5 metres) for 20–30 minutes. Certain variables related to a vendor were counted for 10 minutes.3 Practices in the unit were considered present if exhibited by at least one vendor working there. Observations were discrete and non-participatory, without the knowledge of vendors that they were being observed. Data was captured concurrently using Google Forms, and data analysis was done using Microsoft Excel 2016. Mean, or proportion was used appropriately to describe the data.
Direct identifiers of the vendors were neither recorded nor are given in the results to avoid vendors facing any risk of penalties or loss of benefit. Approval for conducting the study was obtained from the Institute Ethics Committee with a provision for waiver of informed consent to avoid possible social desirability bias that vendors might express due to awareness of being observed for their practices.
RESULTS
Of the 115 SFVUs identified, 102 were functioning actively when we approached for comprehensive observational assessment; 52 in Lawspet (Urban) and 50 in Villianur (Semi-urban). The density of SFVUs by population and land area in Lawspet was 0.58 per 1000 population and 13.5 units per km2. The density of SFVUs by population and land area in Villianur was 1.42 per 1000 population and 3.12 units per km2.
General characteristics of SFVUs
None of the SFVUs displayed an FSSAI licence or certification. Most were in a cart (72%) and served customers at the SFVU as well as provided takeaway service (86%). Only 28% of the units served ready-to-eat foods.
Sanitary conditions and hand washing facilities in the SFVUs
Poor sanitary conditions were found near 63 units (62.4%). Open drains (39, 61.9%) and garbage dumps (32, 50.8%) in the vicinity were commonly responsible for the poor sanitary conditions. Dustbins were found in only 50 units (49%), 24 (46.2%) units in urban and 26 (52%) units in semi-urban areas. Only one unit had a covered dustbin. Places for solid waste disposal were directly observed in 17 units, of which 11 units (64.7%) disposed in the streets and 5 units (29.4%) disposed in nearby open dumps. Of the 51 units for which places of sullage disposal were observed, 32 (62.7%) were near open ground and 19 (37.2%) into drainage.
Ninety-four units required a hand wash facility based on the type of foods served. ‘Some arrangement’ for hand washing was present in 46 units (48.9%)––14 units in urban and 32 units in the semi-urban area. Among these units, only 13 (28.3%) had a facility dedicated to handwashing. Tap water facility was present in only 2 units (4.3%)––1 unit each in urban and semi-urban areas, while other units used buckets filled with water. The use of soap, towels or tissue paper was not observed in any unit. The water source for handwashing was common for both handwashing and cleaning purposes in 33 of 46 units (71.7%)— 57.1% in urban and 78.1% in semi-urban.
Food preparation and service aspects of the SFVUs
Raw foods were separated from cooked foods in all the units, but they were not washed before cooking (Table I). Raw food was exposed to flies and pests in 2 units in the urban area. In 15 units (14.7%), spilt foods were mixed with fresh food. The flow of food handling was unidirectional in 56 units (54.9%). Other characteristics related to food packing are shown in Table I.
| Food handling and processing characteristic | Total | Urban area | Semi-urban area | |||
|---|---|---|---|---|---|---|
| n (%) | N(NA) | n (%) | N(NA) | n (%) | N(NA) | |
| Raw food | ||||||
| Appeared fresh | 46 (45.1) | 102 | 27 (51.9) | 5 2 | 1 9 (38) | 5 0 |
| Was covered | 11 (16.7) | 66 (36) | 6 (14.3) | 42 (10) | 5 (20.8) | 24 (26) |
| Food processing surface | ||||||
| Reused without wiping/cleaning | 62 (87.3) | 71 (31) | 21 (72.4) | 29 (23) | 41 (97.6) | 42 (8) |
| 60–70 cm from ground level | 93 (92.1) | 101 (1) | 46 (88.5) | 52 (0) | 47 (95.9) | 49 (1) |
| Impervious to grease, food, water | 17 (19.5) | 87 (15) | 9 (21.9) | 41 (11) | 8 (17.4) | 46 (4) |
| Cooking practice and cooked food | ||||||
| Cooking utensils broken/chipped | 11 (10.9) | 101 (1) | 7 (13.7) | 51 (1) | 4 (8) | 50 |
| Separate utensils used for different raw materials | 1 2 (19) | 6 3 (39) | 5 (12.5) | 40 (12) | 7 (30.4) | 23 (27) |
| Cooked food kept in clean appearing containers | 60 (64.5) | 22 (51.2) | 3 8 (76) | |||
| Cooked food items stored in separate containers | 56 (60.2) | 9 3 (9) | 18 (41.9) | 4 3 (9) | 3 8 (76) | 5 0 |
| Cooked food kept in closed containers | 27 (29) | 11 (25.6) | 1 6 (32) | |||
| Temperature of cooked food maintained by | 37 (37.8) | 98 (4) | 21 (42) | 5 0 (2) | 1 6 (33.3) | 48 (2) |
| continuous heating | ||||||
| Cooking oil used repeatedly for frying | 48 (82.8) | 58 (44) | 28 (80) | 3 5 (17) | 2 0 (87) | 2 3 (27) |
| Food packaging and serving | ||||||
| Tongs, forceps, spoons used for handling and serving | 84 (82.4) | 102 | 42 (80.7) | 5 2 | 4 2 (84) | 5 0 |
| food (to avoid contact with hand) | ||||||
| Separate utensils (tongs, forceps, spoons) for serving | 26 (72.2) | 36 (66) | 6 (66.7) | 9 (43) | 20 (74) | 2 7 (23) |
| different food items | ||||||
| Handles of serving utensils away from food | 4 3 (71.7) | 60 (42) | 12 (50) | 2 4 (28) | 3 1 (86.1) | 36 (14) |
| Type of packaging materials used* | ||||||
| Plastic cover | 64 (62.7) | 31 (59.6) | 3 3 (66) | |||
| Newspaper | 31 (30.4) | 102 | 16 (30.8) | 5 2 | 1 5 (30) | 5 0 |
| Others (used papers, pre-packed, Styrofoam, plantain leaf) | 9 (8.8) | 7 (13.4) | 2 (4) | |||
| Utensils washing procedure* | ||||||
| Cleaned of debris | 29 (100) | 18 (100) | 11 (100) | |||
| Rinsed | 24 (82.8) | 15 (83.3) | 9 (81.8) | |||
| Detergent used | 3 (10.3) | 29 (73) | 2 (11.1) | 18 (34) | 1 (9.1) | 11 (39) |
| Dipped in common water | 28 (96.6) | 17 (94.4) | 11 (100) | |||
| Scrubbed | 7 (24.1) | 6 (33.3) | 1 (9.1) | |||
| Washed in running water | 2 (6.9) | 0 | 2 (18.2) | |||
In 52 units (50.9%), some kind of cleaning facility for utensils was present, of which 15 units (28.8%) had them within the unit’s structure close to the food processing area. The place for cleaning utensils was adjacent to drains in 22 units (78.6%) and garbage in 9 units (32.1%). A complete washing procedure was observed in 29 units (46.8%), and the characteristics observed during the process are shown in Table I.
Vendor characteristics and practices
A total of 178 vendors (41% women) were present during observation in all the 102 units, 6 appeared to be <18 years of age. Of 178 vendors, 163 (91.6%) were handling food. Gloves, a hair covering net and an apron were not worn during food handling by any vendor. The handwashing habits of food handlers and other behaviours practised by the vendor that were observed are shown in Table II.
| Food handling characteristic | Total | Urban area | Semi-urban area | ||||
|---|---|---|---|---|---|---|---|
| n (%) | N(NA) | n (%) | N(NA) | n (%) | N(NA) | ||
| Hand washing practice observed among food handlers | 1 5 (14.7) | 102 | 6 (11.5) | 5 2 | 9 (18) | 5 0 | |
| Alternate methods to clean hands* | |||||||
| Dipped and washed in turbid water | 37 (52.9) | 21 (41.2) | 16 (32.7) | ||||
| Wiped with stained or soiled cloth | 38 (54.3) | 70 (32) | 17 (33.3) | 51 (1) | 21 (42.9) | 49 (1) | |
| Wiped on dress | 5 (7.1) | 2 (3.9) | 3 (6.1) | ||||
| Practices/behaviour observed during food handling process | |||||||
| Touched the food while serving | 102 (100) | 51 (98.08) | 50 (100) | ||||
| Handled money and food concurrently | 102 (100) | 51 (98.08) | 50 (100) | ||||
| Touched the inner surface of the food parcel containers | 9 5 (93.1) | 46 (88.5) | 4 9 (98) | ||||
| Was wearing jewellery in contact with food | 24 (23.5) | 21 (40.4) | 3 (6) | ||||
| Sneezed/coughed | 12 (11.8) | 102 | 4 (7.7) | 52 | 8 (16) | 50 | |
| Tasted the food with finger | 9 (8.8) | 5 (9.6) | 4 (8) | ||||
| Wore unclean clothes | 6 (5.9) | 4 (7.7) | 2 (4) | ||||
| Blew nose/nose picked | 2 (2) | 1 (1.9) | 1 (2) | ||||
| Handled kerosene | 2 (2) | 1 (1.9) | 1 (2) | ||||
| Had applied bandage on hand | 1 (1) | 0 | 1 (2) | ||||
Quantifying exchanges and unhealthy and healthy practices by vendors recorded for 10 minutes in each unit are summarized in Fig. 1. It was found that vendors more often made contact with food served, their body parts, cash and utensils compared to the number of times they were involved in handwashing or cleaning, and this was similar in both the urban and semi-urban areas.
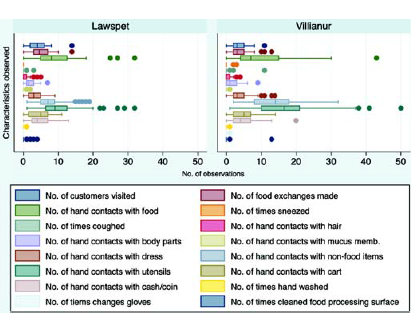
- Box-plot showing the quantification of exchanges, unhealthy and healthy practices by vendors in the two areas
DISCUSSION
Street food vending was common in the urban (Lawspet) and semi-urban (Villianur) study areas in Puducherry. We used purposive sampling as in most similar studies. However, 2 studies estimated sample size based on the proportion of the level of awareness of food safety practices among vendors.8,21 Food safety standards defined by the FSSAI and the WHO essential safety requirements for street food vendors were used for comparison with global and national standards. At the same time, many studies did not specify assessment standards.11,12 In a survey conducted in Manhattan, the practices of the vendors alone were observed.5 To address this limitation of interviewing, we used a non-participatory observational method.
Although vending street food was common, none of the units had displayed their FSSAI licence or certification, a mandatory requirement under the FSSAI Act.12 The unorganized nature of the industry, lack of knowledge and motivation among vendors and poor enforcement of regulations by local authorities could be possible reasons.13 While enforcing regulations, local authorities must thoroughly enumerate SFVUs, train vendors and license units and regularly monitor them.13 Appropriate measures for securing the livelihoods of the destitute vendors, such as by providing monetary support and equipment and facilitating the licensing process, could be inherent in the process as part of a skills development initiative.
Most of the units, particularly their places of cleaning utensils, were located near drains or garbage dumps. This could increase the risk of cross-contamination. It was observed that SFVUs used these drains and dumps for disposal of wet and solid waste. Dustbins were used in only half of the units, and the non-availability of appropriate waste disposal/clearance mechanisms could be the reason for garbage dumping. A solution to this needs to be found by the local bodies and vendors.13
Although present in nearly half of the units, handwash facilities were appropriate only in a few units. In addition, vendors used other alternatives to handwashing, such as dipping and washing hands in buckets of water and repeatedly wiping unclean hands on their clothes or pieces of cloth kept for this purpose. So, while training vendors and providing licenses, these practices must be addressed. Innovation in fitting the safety requirements, such as places for handwashing and separate places for raw and cooked food, within the space-constrained vending carts, is also needed.13
Certain acceptable practices, such as separating raw and cooked foods and using tongs/forceps, were observed in many units. A quantitative method was adopted similar to a study conducted in Manhattan which showed that vendors more often made contact with food served, their body parts, cash and utensils compared to the number of times they were involved in handwashing or cleaning.3
We observed without the vendors’ knowledge, reducing social desirability bias.
Limitations
Assessment of specific characteristics, such as the status of cleanliness of the food processing surface, was subjective, which could have reduced reliability. However, almost all the essential parameters, such as handwashing, dustbin availability, display of FSSAI licence and cleaning practice, were objective or semi-objective observations. A single investigator collected the entire data. This prevented inter-observer variability for subjective observations. The observation was made at a particular instance in the day, and hence practices during the rest of the day that could have been different were not observed. For example, units may follow good practices at the time of opening and when there are fewer consumers compared to the time of closing and when there are more consumers.
Conclusions
Unsatisfactory levels of safe food practices by vendors and lack of adherence to FSSAI norms suggest the need to train vendors regarding food safety practices and regulations. Also providing technical and social support for various constraints in sustaining safe food practices could be helpful.
ACKNOWLEDGEMENT
This study was conducted under the Indian Council of Medical Research–Short Term Studentship.
Conflicts of interest.
None declared
References
- Food Safety. Available at www.who.int/news-room/fact-sheets/detail/food-safety (accessed on 5 Jan 2020)
- [Google Scholar]
- Street vended food in developing world: Hazard analyses. Indian J Microbiol. 2011;51:100-6.
- [CrossRef] [PubMed] [Google Scholar]
- Safety of vendor-prepared foods: Evaluation of 10 processing mobile food vendors in Manhattan. Public Health Rep. 2003;118:470-6.
- [CrossRef] [Google Scholar]
- Street foods in Calcutta. Available at www.fao.org/3/W3699T/w3699t06.htm (accessed on 13 Jan 2020).
- [Google Scholar]
- Street foods–A review, Down the memory lane. Indian J Hygiene Public Health. 2015;1:6-20.
- [Google Scholar]
- Adherence to codex guidelines by street foods vendors of urban Vadodara in Gujarat. Asian J Home Sci. 2008;3:41-7.
- [Google Scholar]
- Food safety and hygiene practices among street food vendors in Delhi India. Int J Curr Res. 2013;5:3531-4.
- [Google Scholar]
- Safety of street foods in Agartala, North East India. Public Health. 2014;128:746-8.
- [CrossRef] [PubMed] [Google Scholar]
- Impact of health education intervention on food safety and hygiene of street vendors: A pilot study. Med J Armed Forces India. 2016;72:265-9.
- [CrossRef] [PubMed] [Google Scholar]
- Street vendors in Patna, India: Understanding the socio-economic profile, livelihood and hygiene practices. Food Control. 2016;70:281-5.
- [CrossRef] [Google Scholar]
- Food hygiene perceptions and safety practices among street food vendors in South Delhi: A cross-sectional study. Int J Sci Res. 2017;6:589-92.
- [Google Scholar]
- Food Safety and Standards Rules 2011. 2011. The Gazette of India. Available at https://fssai.gov.in/upload/uploadfiles/files/FSS_Gazete_Rules_2011.pdf (accessed on 13 Jan 2020).
- [Google Scholar]
- Developing Chandigarh into a safe street food vending town––An intersectoral initiative. Chandigarh:Mohindra Publishing House;.
- [Google Scholar]
- Provisional population totals: Puducherry UT. Census. Available at https://censusindia.gov.in/2011-prov-results/prov_data_products_puducherry.html (accessed on 7 Jul 2021).
- [Google Scholar]
- Puducherry administrative divisions 2011. Available at https://censusindia.gov.in/2011-prov-results/data_files/puducherry/PUDUCHERRY.pdf (accessed on 7 Jul 2021).
- [Google Scholar]
- The Gazette of India. 2014. Available at http://legislative.gov.in/sites/default/files/A2014-7.pdf (accessed on 14 Jan 2020).
- [Google Scholar]
- Essential safety requirements for street-vended foods. 1996. Geneva: WHO; Available at https://apps.who.int/iris/bitstream/handle/10665/63265/WHO_FNU_FOS_96.7.pdf?sequence=1&isAllowed=y (accessed on 5 Jan 2020).
- [Google Scholar]
- Five keys to safer food manual. 2006. Geneva: WHO; Available at http://apps.who.int/iris/bitstream/10665/43546/1/9789241594639_eng.pdf?ua=1 (accessed on 14 Jan 2020).
- [Google Scholar]
- Criteria for audit of food establishments. Available at www.qcin.org/PDF/TFSF/safe_food_criteria_for_ audit2.pdf (accessed on 14 Jan 2020).
- [Google Scholar]
- CII-14 point checklist on food safety for street vended food. 2008. New Delhi: Confederation of Indian Industry; Available at http://face-cii.in/sites/default/files/award_broc_v_1_5.pdf (accessed on 14 Jan 2020)
- [Google Scholar]
- Hygiene status and food handling practices among street food vendors in east delhi: An observational study. J Commun Dis. 2009;41:229-37.
- [Google Scholar]