Translate this page into:
Evaluation of a novel method for teaching drawing of histology diagrams to first year MBBS students
Correspondence to SRIVIDYA SREENIVASAN; srividyasreenivasan@yahoo.com
[To cite: Sreenivasan S, Nakhate MS. Evaluation of a novel method for teaching drawing of histology diagrams to first year MBBS students. Natl Med J India 2024;37:209–14. DOI: 10.25259/NMJI_852_2022]
Abstract
Background
The challenge faced by an undergraduate medical student to draw factually correct histology diagrams needs to be addressed by the use of innovative teaching strategies. We introduced a new method to teach drawing of histology diagrams and compared its outcome with two preexisting methods. We obtained feedback from the students and faculty.
Methods
We introduced an innovation (method 3): A validated hand-drawn pencil sketch of a histology diagram was provided to the students. Students drew on the pencil sketch with haematoxylin and eosin (H&E) pencils and coloured it. They then drew the same diagram afresh. Three diagrams of systemic histology were chosen and the evaluation criteria shared with students. The students drew all three diagrams once, each by a different method. The scores of method 3 were compared with the other two methods, copying from standard atlas (method 1) and from hand-drawn colour chart made by teacher (method 2). Feedback was sought from students and faculty by means of a google form.
Results
A total of 112 students (of 167 who volunteered) completed the study. The mean (SD) score obtained by method 3 (4.83 [0.298]) was higher than the mean score by method 1 (3.91 [0.95]) and method 2 (4.82 [0.27]). There was a statistically significant difference between method 3 and method 1 (p<0.01), and method 2 and method 1 (p<0.01). However, the difference in scores between methods 3 and 2 was not statistically significant (p>0.05).
Conclusion
We found method 3 (the innovation) to be better than one of the pre-existing methods (method 1) but not better than method 2. The quality of diagrams produced by methods 2 and 3 were better than those by method 1, and equally so. The ease of drawing and time taken to draw were the best for method 2. Hence, overall, method 2 may be adjudged the best method.
INTRODUCTION
An area in medical education where teachers and students both encounter a challenge is human histology.1 We, in our experience as teachers of the subject, have found the average undergraduate medical student particularly lacking in the ability to draw a factually correct histology diagram. The above is a requirement of the competency-based medical education curriculum (CBME) currently being followed in India.2
Lyon et al. observed that drawing, besides developing the psychomotor domain of learning, improves understanding of structure through visual and other senses.3
Human histology is taught in our institution by a didactic lecture on the topic followed by a practical session where the student views the slide under a microscope and draws a diagram of the same. He/she uses di Fiore’s atlas of histology and/or hand-drawn charts drawn by the instructor with haematoxylin and eosin (H&E) pencils as a guide to draw the said diagram.4 We observed that most students are unable to draw factually correct diagrams in the first instance and need to be corrected repeatedly. Considering the student strength in most medical colleges in India (150–250) and the time constraints in a practical class (1.5–2 hours), the teacher may approve a diagram that is less than satisfactory.
With this background, there was a need to innovate in the teaching of drawing human histology. We introduced a new method to teach drawing of histology diagrams, and compared its outcome with pre-existing methods. We also evaluated the perception of this innovation by the participants and faculty involved in the project.
METHODS
This educational research, interventional study was approved by the Institutional Ethics Committee. A total of 167 first year MBBS student volunteers (out of 250) from the batch of 2019– 20 participated in the study.
They were made to draw histology diagrams under the supervision of the faculty after the conduct of the relevant theory lecture as per the lecture schedule. Validated specific criteria that would be used to evaluate the diagrams were shared with the faculty and participants.
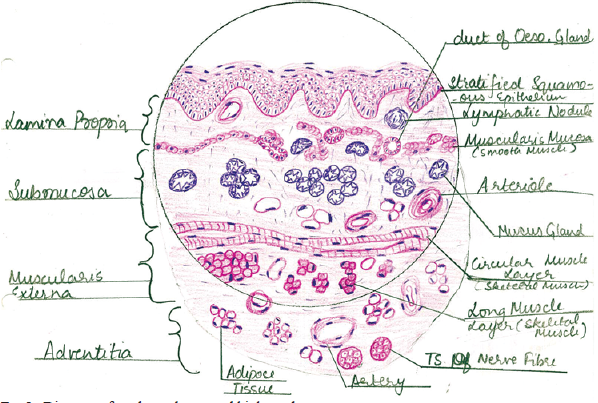
The participants were divided into three groups by randomization. Each of these groups was asked to draw a diagram of the transverse section (TS) of the upper one-third of the oesophagus (Diagram 1) by one of the following three methods in the same practical session.
Method 1. Draw using a colour print-out provided from di Fiore’s atlas of histology as a guide (Fig. 1).
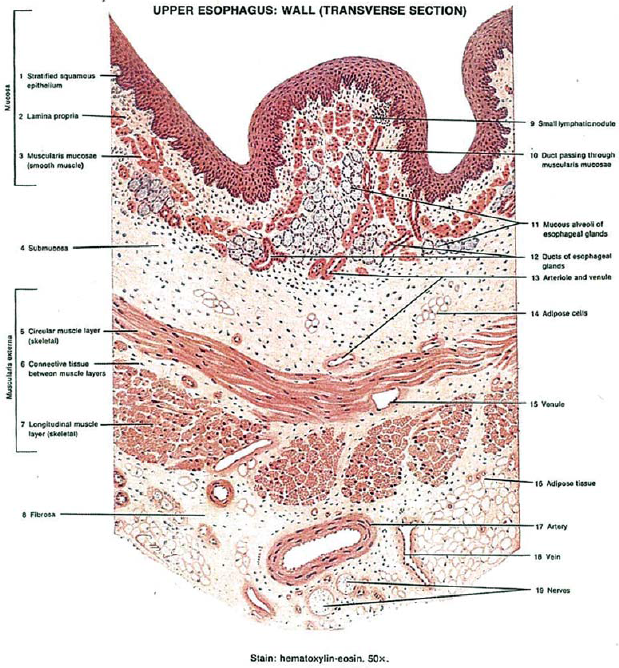
- Reference diagram provided for method 1
Method 2. Draw using a colour print-out of validated colour hand-drawn chart (H&E) prepared by the principal investigator provided as a guide (Fig. 2).
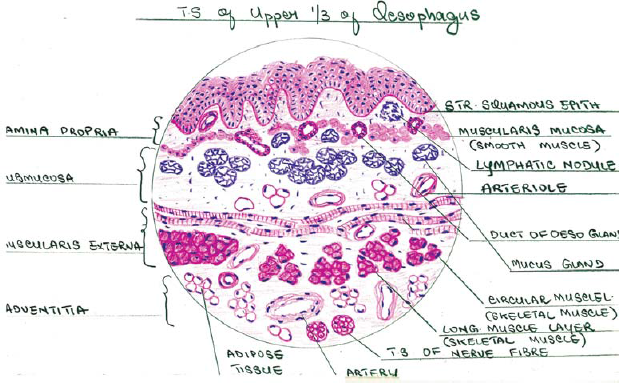
- Reference diagram provided for method 2
Method 3. Draw using the innovated method as described: A print-out of a validated hand-drawn pencil sketch of the diagram was provided to the student (Fig. 3).
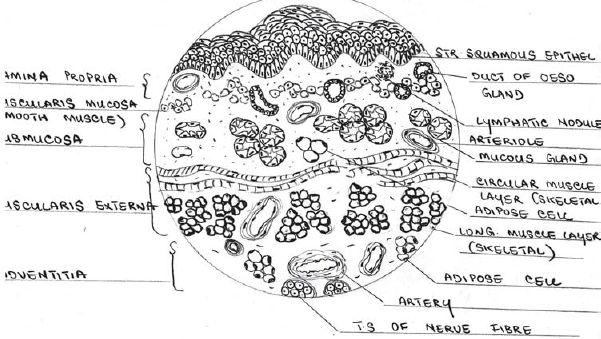
- Reference diagram provided for method 3
Step 1: The student drew over the pencil sketch with H&E pencils and coloured it (Fig. 4).
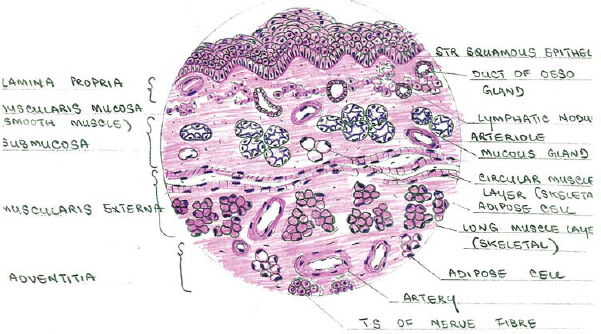
- Method 3, Step 1
- Diagram of student who scored high marks
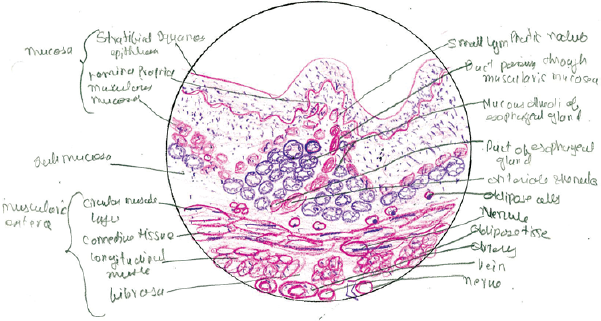
- Diagram of student who scored low marks
Step 2: The student now drew the same diagram afresh with H&E pencils.
Individual print-outs and coded worksheets were given to each participant for drawing the diagram.
Each of the groups of students was now subjected to two cross-overs, such that, a diagram of the TS of the liver lobule (Diagram 2) and TS of the trachea (Diagram 3) were also drawn by every participant, and all participants were exposed to drawing diagrams by all three methods.
The entire exercise was conducted over 3 weeks in batches of not more than 40 participants in a batch to ensure that each student drew the diagrams under active faculty supervision. However, the faculty did not interfere in the drawing process.
A total of 112 students (of the 167 who volunteered) drew diagrams by all three methods. Therefore, only these 112 students were included in the study.
Each of these diagrams was evaluated by two different teachers (observers), who were not part of the coding process and given marks out of 5 as per the evaluation criteria. For each diagram, the mean score given by the two teachers was considered. Then the principal investigator decoded the diagrams and classified them as per the method used.
Perception of the student participants and the faculty who helped in the conduct of the study about all three methods adopted and the project overall was elicited by means of a validated feedback questionnaire administered as a google form.
Data analysis
All scores were entered into a computer by giving a coding system, proofed for entry errors.
Data obtained were compiled on a MS Office Excel Sheet (v 2019, Microsoft Redmond Campus, Redmond, Washington, USA). Data were subjected to statistical analysis using Statistical package for social sciences (SPSS v 26.0, IBM).
The data were on a scale; hence non-parametric tests were used for comparisons.
Intergroup comparison (>2 groups) was done using Kruskall–Wallis ANOVA followed by pair-wise comparison using the Mann–Whitney U test.
Intraclass correlation (ICC) was done to check the agreement between the two observers.
For all statistical tests, p<0.05 was considered to be significant keeping the α error at 5% and β error at 20%, thus giving 80% power to the study.
Evaluation of perception was done as per rating on the Likert scale
At least 60% of students and faculty should have given a rating of 4 out of 5 or above on the Likert scale as a short-term indicator of satisfaction.
At least 60% of students and faculty should have perceived the time taken to draw the diagram by a given method to be less than 30 minutes as a short-term indicator of feasibility.
RESULTS
A total of 112 students completed the study and 336 diagrams were evaluated. Sample diagrams drawn by the students, which scored high and low marks, are shown in Figs 5 and 6, respectively.
A significant difference was seen on comparison of the scores obtained by the three methods by the Kruskal–Wallis test (p<0.01); with observer 1 giving higher scores to method 3, observer 2 giving higher scores to methods 2 and 3 and the mean of the scores given by the two observers being highest for method 3. However, the difference in the mean of observer scores for methods 2 and 3 was not statistically significant.
On performing the Mann–Whitney U test to compare the inter-method scores, the values showed a highly significant difference between methods 3 and 1 (p<0.01) and methods 2 and 1 (p<0.01), while the values obtained by comparing scores of methods 3 and 2 showed a difference that was not statistically significant (p>0.05; Table I).
| Score | Method | v. Method | Mann–Whitney U value | Z value | p value of Mann–Whitney U test |
|---|---|---|---|---|---|
| Observer 1 | 1 | 2 | 2362.5 | –8.389 | <0.001 |
| 1 | 3 | 2279.0 | –8.599 | <0.001 | |
| 2 | 3 | 5925.0 | –0.822 | 0.41 | |
| Observer 2 | 1 | 2 | 2472.5 | –8.967 | <0.001 |
| 1 | 3 | 2457.5 | –9.034 | <0.001 | |
| 2 | 3 | 6218.0 | –0.230 | 0.82 | |
| Mean score | 1 | 2 | 2002.5 | –9.049 | <0.001 |
| 1 | 3 | 1947.5 | –9.198 | 0.001 | |
| 2 | 3 | 6054.5 | –0.504 | 0.61 |
A strong agreement was observed between observers (single measure values >0.7) for method 1, fair agreement between scores given by the two observers for method 2 (single measure values >0.3 to 0.4) and poor agreement between the two observers for scores given for method 3 (single measure values <0.2; Table II).
| Variable | Intraclass correlation | Lower bound | Upper bound | Value | p value | |
|---|---|---|---|---|---|---|
| Method 1 observer 1 v. observer 2 | Single measures | 0.701 | 0.593 | 0.784 | 5.687 | <0.001 |
| Average measures | 0.824 | 0.744 | 0.879 | 5.687 | <0.001 | |
| Method 2 observer 1 v. observer 2 | Single measures | 0.391 | 0.223 | 0.537 | 2.286 | <0.001 |
| Average measures | 0.563 | 0.364 | 0.699 | 2.286 | <0.001 | |
| Method 3 observer 1 v. observer 2 | Single measures | 0.191 | 0.006 | 0.363 | 1.471 | 0.02 |
| Average measures | 0.320 | 0.012 | 0.532 | 1.471 | 0.02 | |
Perception analysis results
A total of 104 of the 112 students who completed the study, and all faculty (7) who witnessed the conduct of the study responded to the questionnaire.
All three methods under consideration were rated 4/5 or above on the Likert scale by at least 60% of faculty and students, thereby achieving the criterion of satisfaction with the method. However, 93.2% students rated method 2, 4/5 or above on an ascending Likert scale for ease of drawing compared to 77% for method 3, and 64.5% for method 1; 100% faculty rated methods 2 and 3, 4/5 or above for ease of drawing diagrams compared to 78% for method 1. More than 75% of students and almost all the faculty felt that the project helped in increasing the level of interest in the subject, improved retention and improved understanding of histology; 87.5% of students and 85.8% of faculty felt that the students enjoyed drawing diagrams as part of this project (Table III).
| Student/faculty 1 2 3 | 1 | 2 | 3 | 4 | 5 |
|---|---|---|---|---|---|
| Drawing the diagram afresh after drawing with H&E pencils on pencil sketch of diagram provided as a guide was easy | |||||
| Student | 1 (1) | 5 (4.8) | 18 (17.3) | 31 (29.8) | 49 (47.1) |
| Faculty | 0 (0) | 0 (0) | 0 (0) | 2 (28.6) | 5 (71.4) |
| Drawing the diagram with H&E diagram provided as a guide was easy | |||||
| Student | 0 (0) | 0 (0) | 7 (6.7) | 30 (28.8) | 67 (64.4) |
| Faculty | 0 (0) | 0 (0) | 0 (0) | 0 (0) . | 7 .(100) |
| Drawing the diagram with printed diagram from di Fiore’s atlas of histology provided as guide was easy | |||||
| Student | 7 (6.7) | 10 (9.6) | 20 (19.2) | 27 (26) . | 40 (38.5) |
| Faculty | 0 (0) | 0 (0) | 2 (28.6) | 3 (42.9) | 2 (28.6) |
| Drawing diagrams as part of this project was an enjoyable experience | |||||
| Student | 0 (0) | 2 (1.9) | 11 (10.6) | 34 (32.7) | 57 (54.8) |
| Faculty | 0 (0) | 1 (14.3). | 0 (0) | 3 (42.9) | 3 (42.9) |
| The exercise helped in understanding of the subject | |||||
| Student | 1 (1) | 1 (1). | 13 (12.5) | 39 (37.5) | 50 (48.1) |
| Faculty | 0 (0) | 0 (0) | 0 (0) | 2 (28.6) | 5 (71.4) |
| The exercise increased the level of interest in histology | |||||
| Student | 1 (1) | 2 (1.9) | 23 (22.1) | 38 (36.5) | 40 (38.5) |
| Faculty | 0 (0) . | 0 (0) . | 0 (0) . | 2 (28.6) | 5 (71.4) |
| The exercise will help in retention of the subject | |||||
| Student | 2 (1.9) | 2 (1.9) | 23 (22.1) | 26 (25) . | 51 (49) . |
| Faculty | 0 (0) | 0 (0) | 0 (0) | 1 (14.3) | 6 (85.7) |
The time taken to draw a diagram was perceived to be less than 30 minutes across methods by at least 60% of students and faculty. All three methods therefore met the basic criterion of feasibility that had been set. However, the time taken for drawing the diagram was <20 minutes as perceived by 65% of students for method 2, compared to 51% for method 3 and 44% for method 1; 71% of faculty perceived time taken to draw the diagram to be <20 minutes for methods 2 and 3. All the faculty perceived time taken to draw the diagram by method 1 to be >20 minutes; 26.5% of students and 37.5% of faculty were of the opinion that other areas could be included in this study. Some of the suggestions were: (i) a timed study by which accurate and sufficiently detailed diagrams could be drawn by the students simulating the conditions of an examination; (ii) a similar method could be used for teaching drawing of gross anatomy and embryology diagrams; and inclusion of more topics from the gastrointestinal system histology such as the stomach and the intestine.
DISCUSSION
Histology is the foundation of histopathology, just as an understanding of gross anatomy is vital for understanding surgery.
Our study appears to be the first of its kind, as we did not come across a similar study after a thorough review of the literature. There is a cohort of teachers and students of anatomy who feel that drawing histology diagrams is a waste of time and that it converts the histology practical into an art class.5 However, art and art forms have been used as a tool to improve understanding of anatomy and medicine. Noorafshan et al. used simultaneous sketching of anatomy diagrams with the teacher as an interactive learning tool in a quasi-experimental study; 80% of students felt that learning anatomical concepts was easier and more fun by the use of this method.6 Tamara Franz-Odendaal and Karen Pinder have been awarded the American Association of Anatomists (AAA) innovation grant for the year 2021, an amount of $50 000 for introducing a histology colouring book for undergraduate students to make the learning of histology more hands-on and interactive.7 In their opinion, the process of colouring uses a multisensory approach: it uses the psychomotor domain of learning, develops spatial sense and allows visual processing of details. We are in agreement with them that colouring provides a relaxed way to learn.
In the feedback obtained, some students felt that the innovation took up more of their time when compared to method 2. Some students resented drawing the same diagram twice. We have all been through kindergarten and honed our handwriting skills after hours of cursive writing practice. The histological structure of tissues is a new alphabet that undergraduate students need to master in the language, i.e. the science of microscopic anatomy. The tracing over pre-drawn diagram followed by colouring it can be a useful aid in teaching students the nuances of drawing a diagram. This method has the additional advantage of assessing recall and comprehension as the student has to choose the correct colour for every component of the diagram.
In our study, the specification of five evaluation criteria for each diagram provided the student with key and vital areas to focus on in the complex diagrams that were chosen. In our opinion, sharing the evaluation criteria helped students in their understanding of histology across all three methods. Amer et al. have found the objective structured practical examination (OSPE) to be beneficial as an evaluation tool for histology using both conventional (CM) and virtual microscopy (VM).8 We have used what we term as an objective structured practical instruction (OSPI). By sharing the evaluation criteria with the students, we provided them with specific learning objectives. The high scores achieved by the students across methods suggests that this particular intervention (OSPI) is beneficial.
There is poor agreement between the observers for scores of method 3 and only a fair level of agreement for method 2. This is despite them being blinded to the method by which the diagram was drawn. The observers seem to be in agreement while scoring diagrams that received poorer scores (method 1). There seems to be lesser agreement between the observers for diagrams that got higher scores (drawn by methods 3 and 2). Despite there being a checklist to make the evaluation objective, there appears to be a certain level of subjectivity while performing a nuanced evaluation of histology diagrams.
Limitations
The lack of agreement between the two observers in terms of scores given does not allow us to draw robust conclusions from this study.
Future scope
Recording the time taken by individual participants for drawing by different methods, inclusion of diagrams of other aspects of anatomy and introduction of an assessment method to analyse the outcome may be introduced to expand the scope of this study.
Conclusion
On the basis of scores obtained and feedback in our study, it seems that hand-drawn charts are a better aid to teach drawing of histology diagrams compared to photomicrographs. Our innovation of making the student trace the diagram and colour it before independently drawing it, was found to be significantly better than copying from a standard atlas and comparable to copying from hand-made colour charts made by the principal investigator in terms of the quality of diagrams produced by the students. However, in terms of ease of drawing and time taken to draw, method 2 was the best. Hence, overall copying from hand-made colour charts made by the teacher was found to be the best method to teach drawing of histology diagrams. OSPI, discovered as a byproduct of this study, if found to be beneficial, may be introduced as a part of the CBME curriculum.
ACKNOWLEDGEMENTS
We acknowledge Dr Rupali Shastrakar for evaluation of the diagrams; Drs Simmi Mehra, Rashmi Patil and Rajneesh Pandey for validation of diagrams and questionnaire; and Dr V. Sreenivasan for reviewing our manuscript prior to submission.
Conflicts of interest
None declared
References
- Structured, functional histology practical modules: An answer to medical student's histology nightmare and the way forward for relevant histology instruction in the Indian undergraduate medical curriculum? Natl Med J India. 2020;33:166-71.
- [CrossRef] [Google Scholar]
- Competency based undergraduate curriculum for the Indian medical graduate. Volume 1
- [Google Scholar]
- An exploratory study of the potential learning benefits for medical students in collaborative drawing: Creativity, reflection and 'critical looking' BMC Med Educ. 2013;13:86.
- [CrossRef] [Google Scholar]
- di Fiore's Atlas of histology with functional correlations (8th ed). London: Williams and Wilkins; 2018.
- [Google Scholar]
- Student's perception of teaching learning method in dissection and histology lab. IOSR J Dental Med Sci. 2014;13:24-8.
- [CrossRef] [Google Scholar]
- Simultaneous anatomical sketching as learning by doing method of teaching human anatomy. J Educ Health Promot. 2014;3:50.
- [CrossRef] [Google Scholar]
- Awards, Innovations Program, Past Innovations Program Recipients. 2021. Available at www.anatomy.org/AAA/AAA/Awards/Innovations-Program.aspx?hkey=b3c18700-d491-4342-bc21-2773f2e57faf (accessed on 9 Aug 2022).
- [Google Scholar]
- Successful use of virtual microscopy in the assessment of practical histology during pandemic COVID-19: A descriptive study. J Microsc Ultrastruct. 2020;8:156-61.
- [CrossRef] [Google Scholar]