Translate this page into:
Haemogram indices are as reliable as CURB-65 to assess 30-day mortality in Covid-19 pneumonia
[To cite: Bardakci O, Das M, Akdur G, Akman C, Siddikoglu D, Akdur O, et al. Haemogram indices are as reliable as CURB-65 to assess 30-day mortality in Covid-19 pneumonia. Natl Med J India 2022;35:221–8.]
Abstract
Background
Mortality due to Covid-19 and severe community-acquired pneumonia (CAP) remains high, despite progress in critical care management. We compared the precision of CURB-65 score with monocyte-to-lymphocyte ratio (MLR), neutrophil-to-lymphocyte ratio (NLR), platelet-to-lymphocyte ratio (PLR) in prediction of mortality among patients with Covid-19 and CAP presenting to the emergency department.
Methods
We retrospectively analysed two cohorts of patients admitted to the emergency department of Canakkale University Hospital, namely (i) Covid-19 patients with severe acute respiratory symptoms presenting between 23 March 2020 and 31 October 2020, and (ii) all patients with CAP either from bacterial or viral infection within the 36 months preceding the Covid-19 pandemic. Mortality was defined as in-hospital death or death occurring within 30 days after discharge.
Results
The first study group consisted of 324 Covid-19 patients and the second group of 257 CAP patients. The non-survivor Covid-19 group had significantly higher MLR, NLR and PLR values. In univariate analysis, in Covid-19 patients, a 1-unit increase in NLR and PLR was associated with increased mortality, and in multivariate analysis for Covid-19 patients, age and NLR remained significant in the final step of the model. According to this model, we found that in the Covid-19 group an increase in 1-unit in NLR would result in an increase by 5% and 7% in the probability of mortality, respectively. According to pairwise analysis, NLR and PLR are as reliable as CURB-65 in predicting mortality in Covid-19.
Conclusions
Our study indicates that NLR and PLR may serve as reliable predictive factors as CURB-65 in Covid-19 pneumonia, which could easily be used to triage and manage severe patients in the emergency department.
INTRODUCTION
The outbreak of coronavirus disease 2019 (Covid-19) caused by severe acute respiratory syndrome coronavirus-2 (SARS-CoV-2) placed a great strain on the health systems of many countries as well as the Turkish National Health System. Since the numbers of infected and fatal cases are rising worldwide, there is a need to investigate the clinical, laboratory and radiological characteristics, and more importantly, the risk factors for mortality in severe Covid-19. Therefore, effective clinical risk-stratication tools for Covid-19 patients were required to provide validation of a decision model for triaging, particularly in overwhelmed emergency departments and urgent care centres.1
Whether of bacterial or viral origin, the primary clinical assessment of pneumonia necessitates a systematic effort to prioritize disease severity which is critical in guiding therapeutic decision-making such as the need for hospital admission or intensive care unit (ICU) management. In this context, CURB-65 pneumonia severity score is a widely used scoring method to guide the treatment of patients with community-acquired pneumonia (CAP). CURB-65 consists of five quickly obtained parameters including confusion, blood urea levels, respiratory rate, blood pressure and age.2 CURB-65 has been validated to predict clinical outcomes and mortality in CAP, but its efficacy in both critical CAP and Covid-19 is unclear.3 Thus, most components of CURB-65 are used as general prediction tools, and increased age is partially related with enhanced morbidity and mortality. Therefore, it would be valuable to use other outcome prediction instruments as earlier as possible, to take actions timely to improve predictive performance of CURB-65.
The neutrophil-to-lymphocyte ratio (NLR), platelet-tolymphocyte ratio (PLR) and the monocyte-to-lymphocyte ratio (MLR) are easily available haematological indices that provide information about the systemic inflam-mation.4 Elevated NLR and PLR are related with the severity of patients with infectious disorders, inflammatory bowel diseases, pancreatitis, coronary heart disease and tumors.5–7 Hence, studies have proposed that dynamic alterations in these parameters could reflect the severity of Covid-19. Nevertheless, no studies have simultaneously explored the predictive values of NLR, PLR and MLR and compared these with CURB-65 and other indices in predicting the mortality in CAP and Covid-19 patients. We did a retrospective study to compare these haematological parameters and CURB-65 as predictive tools of mortality so that a management plan could be developed soon after hospital admission by attending physicians according to the resources of the healthcare facility.
METHODS
Patients and controls
This retrospective case–control study was conducted after approval from the institutional review board of Canakkale Onsekiz Mart University (COMU). Two study groups of patients with Covid-19 and CAP as well as healthy controls were included. The first study group consisted of 324 patients with Covid-19 admitted to the emergency department of COMU hospital between 23 March 2020 and 31 October 2020. The second study group included 257 CAP patients with either bacterial or viral infection admitted to the same hospital in the 36 months preceding the Covid-19 pandemic. Controls were recruited from healthy persons without any history of acute or chronic inflammatory diseases admitted to the internal medicine department for routine check-up.
The Covid-19 patients were diagnosed by a real-time reverse transcription-polymerase chain reaction (RealStar Altona®) assay in nasal and pharyngeal swab specimens with confirmed radiological signs of pneumonic infiltration. The diagnosis of CAP was made based on clinical symptoms of acute lower respiratory tract infection and the presence of focal signs on physical examination of the chest and new radiological findings suggestive of pulmonary infiltrates. Patients with acute or chronic inflammatory disorders, tumoural conditions, severe immunosuppression, hospital-acquired pneumonia and a confirmed alternative diagnosis were excluded. Patients who had not had a computed tomography scan were also excluded.
Clinical data of the patients were collected from the COMU hospital information management system during inpatient care and after discharge up to 30 days. All data that were entered by the medical team were anonymised without any patient identifiers and included clinical and demographic factors (e.g. age at admission, sex, vital parameters and symptoms), medical history (e.g. date of diagnosis of Covid-19, comorbid conditions at diagnosis, ICU admission, in-hospital mortality and death up to 30 days after discharge) and laboratory indicators (e.g. complete blood count and clinical biochemistry analysis) for each participant. All complete blood count analysis was performed in the COMU hospital by a monthly calibrated automated commercial analyser (Beckman Coulter, High Wycombe, UK) within 2 hours after collection of blood samples.
Severity of pneumonia either due to Covid-19 or CAP was measured by CURB-65. CURB-65 score classes were assigned according to the authors’ original designations.8 Patients were stratified into low-risk (classes 0–1), intermediate-risk (class 2) and high-risk classes (classes 3–5).
Power analysis was performed using G*Power3.1.9 The original study design required enrolling 324 Covid-19-positive patients and 257 CAP patients. The statistical calculation was done with 80% power, p<0.05 significance and an average size of the effect in the population. The calculation determined an ideal sample of 300 patients for Covid-19-positive and 220 for the CAP group.
Prognostic scores
The CURB-65 score was calculated based on the values recorded at the time of admission to the emergency department. The variables included in CURB-65 score are as follows: age >65 years, confusion, urea >7 mmol/L, respiratory rate 30 breaths/ minute, blood pressure systolic <90 mmHg or diastolic <60 mmHg. The NLR and PLR were calculated at admission from the differential counts by dividing the absolute neutrophil count by the absolute lymphocyte count and by dividing the platelet count by the absolute lymphocyte count, respectively. The MLR was calculated from the differential counts by dividing the monocyte count by the absolute lymphocyte count. SI was calculated according to the formula (SI)=Heart rate/Systolic blood pressure.
Outcomes measures
The outcome measures were ICU admission and 30-day all-cause mortality. ICU admission was defined as admission to any of the hospital ICU beds during hospitalization due to pneumonia. Outcome measure for mortality was defined as death from any cause within 30 days after discharge.
Statistical analysis
Categorical variables were expressed as frequencies and percentages (%). Continuous variables were expressed as mean (standard deviation; SD). The Shapiro–Wilk test was used to assess normality for the continuous variables. The differences in proportions between the groups were compared using Chi-square or Fisher exact tests as appropriate. The Student t-test was used to compare continuous variables in two independent groups. Odds ratios (95% confidence intervals [CI]) of the independent clinical parameters were calculated with univariate and multiple logistic regression models to predict the outcome variables: high-risk patients (CURB-65 ≥3) and 30-day mortality. A multiple logistic regression analysis was built by performing stepwise variable selection on those variables with a univariate p<0.25. The Hosmer–Lemeshow test was computed to detect goodness of fit in the multiple logistic regression models, and a non-significant p value indicated a good fit. Receiver operating characteristic (ROC) curve analysis was used to calculate the areas under the receiving operator curves (AUC) and 95% confidence intervals for study parameters to predict 30-day mortality in Covid-19 pneumonia and CAP patients. The DeLong test was used for a pairwise comparison of AUCs.10 All statistical analyses were conducted using SPSS 19.0 for Windows Version 19.0 software (IBM Corp., Armonk, NY, USA) and R software version 3.6.2. A value of p<0.05 was considered statistically significant.
RESULTS
The first study group consisted of 324 Covid-19 patients (M/ F: 165/159) and the second group consisted of 257 CAP patients (M/F: 169/88). The control group consisted of 121 healthy adults (M/F: 64/57). The mean (SD) age of Covid-19, CAP and control patients was 53.3 (15.9), 72.9 (14.1) and 64.4 (14.0) years, respectively. The baseline demographics and clinical and laboratory characteristics of the study participants are given in Table I. A statistically significant increase in MLR, NLR and PLR levels was observed in both study groups compared with healthy controls (p<0.001 for all three parameters; Fig. 1). According to the CURB-65 scores, 6.8% of Covid-19 patients were classified as high-risk class, whereas 57.6% of CAP patients were classified as high-risk patients.
| Characteristic | Covid-19 (n=324) | CAP (n=257) | Controls (n=121) | p value |
|---|---|---|---|---|
| Mean (SD) age in years | 53.33 (15.92) | 72.93 (14.14) | 64.41 (14.03) | <0.001 |
| Gender (men/women), n(%) | 165 (50.9)/ | 169 (65.8)/ | 64 (52.9)/ | 0.007 |
| 159 (49.1) | 88 (34.2) | 57 (47.1) | ||
| Vital parameters | ||||
| Systolic blood pressure (mmHg) | 131.09 (16.84) | 109.62 (22.53) | – | <0.001 |
| Diastolic blood pressure (mmHg) | 81.02 (11.01) | 69.70 (16.22) | – | <0.001 |
| Mean arterial pressure (mmHg) | 97.71 (11.18) | 83.01 (17.53) | – | <0.001 |
| Heart rate (per minute) | 88.87 (14.29) | 101.81 (19.05) | – | <0.001 |
| Respiratory rate (per minute) | 19.42 (2.88) | 21.56 (5.56) | – | <0.001 |
| Comorbid conditions, n (%) | ||||
| Cardiovascular disease | 46 (24.7) | 85 (40.5) | – | 0.001 |
| Central nervous system | 22 (12.0) | 59 (28.1) | – | <0.001 |
| Pulmonary disease | 17 (9.2) | 100 (47.6) | – | <0.001 |
| Renal disease | 9 (4.9) | 19 (9.0) | – | 0.109 |
| Hypertension | 101 (54.6) | 102 (48.6) | – | |
| Malignancy | 3 (1.6) | 25 (11.9) | – | <0.001 |
| Other diseases | 102 (54.3) | 23 (11.0) | – | <0.001 |
| Laboratory parameters | ||||
| Haemoglobin (g/dl) | 13.28 (1.81) | 11.98 (2.03) | 14.36 (11.67) | <0.001 |
| Platelet (×103 μl) | 215.41 (86.27) | 264.73 (113.53) | 249.09 (93.46) | <0.001 |
| White blood cells (×103 μl) | 6.62 (3.2) | 14.09 (6.78) | 6.91 (1.77) | <0.001 |
| MLR | 0.56 (0.76) | 0.81 (1.15) | 0.30 (0.17) | <0.001 |
| NLR | 5.04 (9.10) | 14.53 (15.94) | 2.56 (2.48) | <0.001 |
| PLR | 188.57 (153.74) | 298.69 (243.42) | 139.56 (122.10) | <0.001 |
| C-reactive protein (mg/dl) | 7.51 (5.89) | 13.93 (11.52) | 0.61 (0.97) | 0.026 |
| Shock index | 0.71 (0.38) | 0.99 (0.37) | – | <0.001 |
| Urea (mg/dl) | 30.39 (21.86) | 53.96 (208.38) | 24.43 (26.91) | 0.038 |
| Creatinine (mg/dl) | 0.97 (0.68) | 1.41 (1.34) | 0.90 (0.22) | <0.001 |
| Alanine aminotransferase (U/L) | 26.90 (21.93) | 35.67 (111.25) | 19.19 (21.97) | 0.078 |
| Aspartate aminotransferase (U/L) | 30.39 (21.86) | 53.96 (208.38) | 24.43 (26.91) | 0.038 |
| CURB-65 score, n (%) | ||||
| Low (score 0–1) | 257 (79.3) | 35 (13.6) | – | <0.001 |
| Intermediate (score 2) | 45 (13.9) | 74 (28.8) | – | |
| High (score 3–5) | 22 (6.8) | 148 (57.6) | – | |
| ICU admission, n(%) | 17 (5.2) | 81 (31.5) | – | <0.001 |
| ICU (days) | 15.68 (20.93) | 11.04 (17.92) | – | 0.165 |
CAP community-acquired pneumonia MLR monocyte-to-lymphocyte ratio NLR neutrophil-to-lymphocyte ratio PLR platelet-to-lymphocyte ratio ICU intensive care unit SD standard deviation CURB confusion, urea nitrogen, respiratory rate, blood pressure
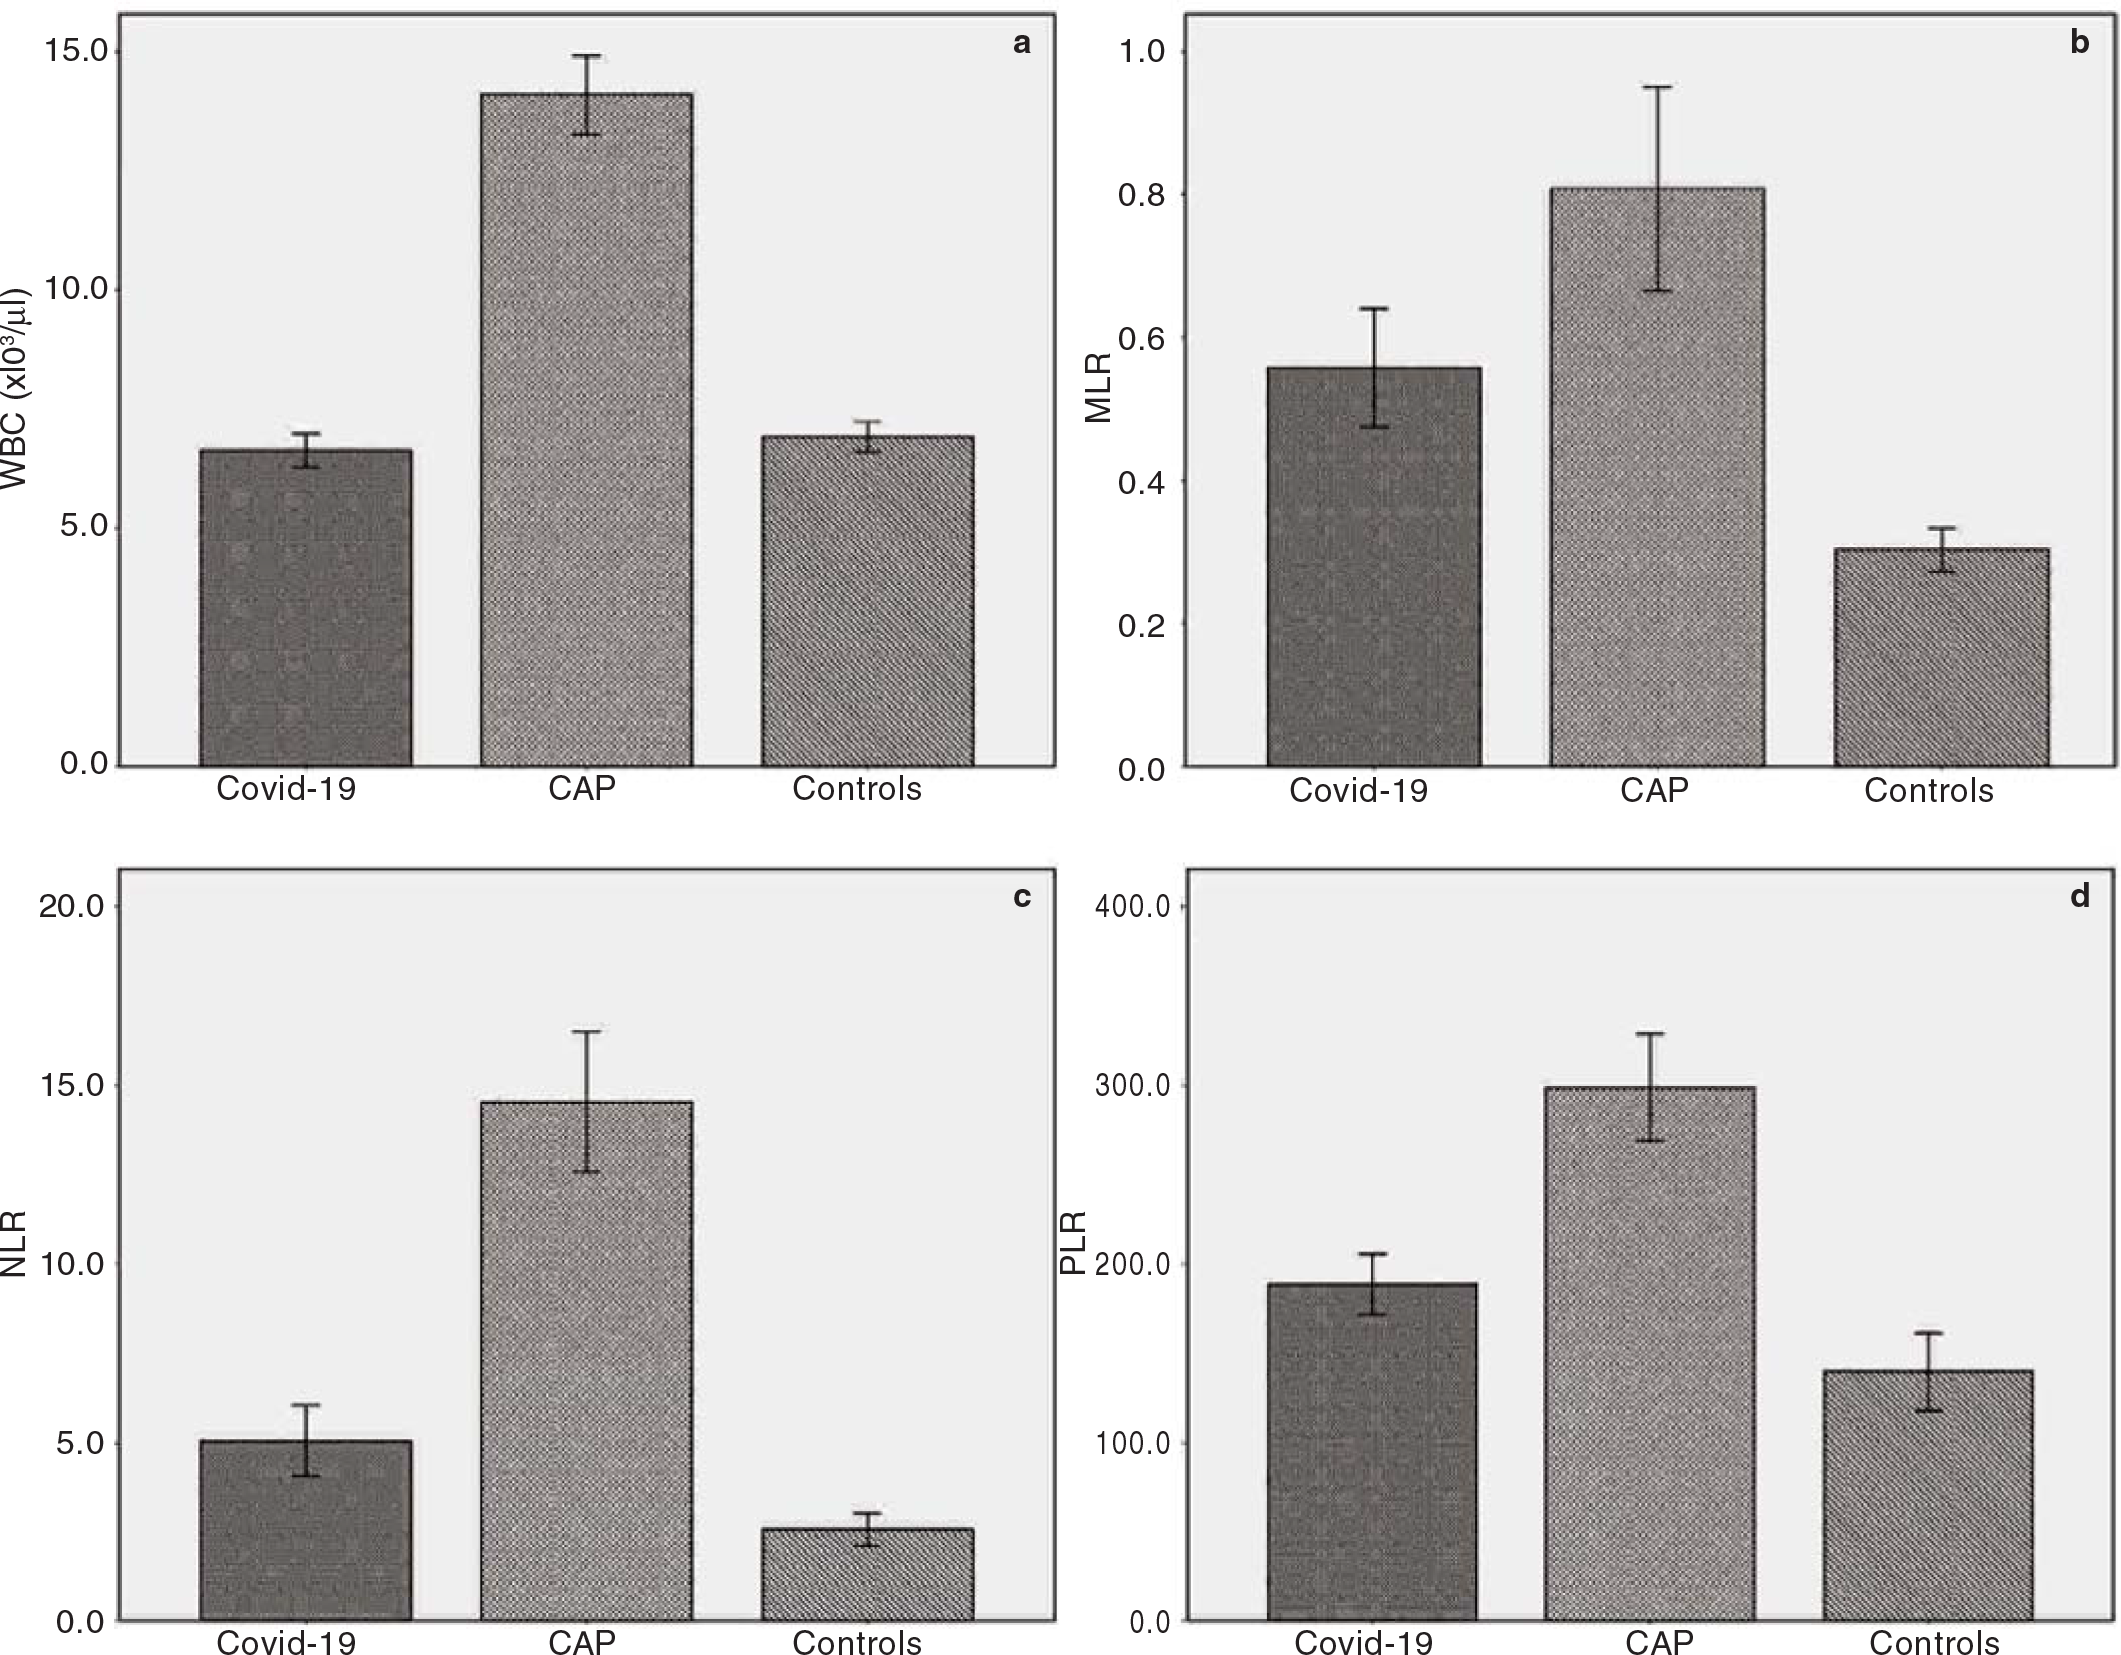
- Bar charts with error bars showing (a) white blood cells (WBC); (b) monocyte-to-lymphocyte ratio (MLR); (c) neutrophil-tolymphocyte ratio (NLR); (d) platelet-to-lymphocyte ratio (PLR) in the study groups
During the hospital stay and 30-day follow-up 18 patients with Covid-19 died (5.6%) and 64 patients with CAP died (25%). Although the non-survivor Covid-19 group had significantly higher MLR, NLR and PLR values, no significant association was found in MLR (p=0.08), NLR (p=0.12) and PLR (p=0.39) between the CAP patients according to their survival status. SI levels of Covid-19 patients were similar (p=0.83) in both the survivor and non-survivor groups, whereas non-survivor CAP patients had significantly elevated SI levels (p<0.001). As expected, non-survivors had higher CURB-65 scores in both Covid-19 and CAP patients. The comparison of other clinical and analytical variables between study groups in terms of survival status is given in Table II.
| Item | Covid-19 | Community-acquired pneumonia | ||||
|---|---|---|---|---|---|---|
| Survivors (n=306) | Non-survivors (n=18) | p value | Survivors (n=193) | Non-survivors (n=64) | p value | |
| Age (years) | 52.29 (15.57) | 71 (10.78) | <0.001 | 71.09 (15.07) | 78.48 (8.87) | <0.001 |
| Gender (men/women) | 152/154 | 13/5 | 0.063 | 125/68 | 44/20 | 0.561 |
| Comorbid conditions n (%) | ||||||
| 0 | 142 (95.9) | 6 (4.1) | 0.025 | 36 (76.6) | 11 (23.4) | 0.385 |
| 1 | 83 (97.6) | 2 (2.4) | 52 (69.3) | 23 (30.7) | ||
| >1 | 81 (89.0) | 10 (11.0) | 105 (77.8) | 30 (22.2) | ||
| Haemodynamic parameter | ||||||
| Mean arterial pressure (mmHg) | 98.01 (10.96) | 92.76 (13.95) | 0.053 | 87.08 (15.94) | 70.74 (16.46) | <0.001 |
| Heart rate (per minute) | 89.08 (14.8) | 85.22 (15.93) | 0.266 | 97.87 (17.53) | 113.68 (18.66) | <0.001 |
| Respiratory rate (per minute) | 19.12 (2.48) | 24.67 (4.09) | <0.001 | 19.90 (4.12) | 26.58 (6.33) | <0.001 |
| Laboratory | ||||||
| Haemoglobin (g/dl) | ||||||
| Platelet (×103 μl) | ||||||
| White blood cell (×103 μl) | 6.43 (2.91) | 9.83 (5.58) | 0.02 | 13.46 (6.15) | 15.97 (8.16) | 0.026 |
| MLR | 0.49 (0.63) | 1.71 (1.46) | 0.002 | 0.81 (1.02) | 0.78 (1.49) | 0.082 |
| NLR | 4.00 (4.50) | 22.69 (29.36) | 0.015 | 13.64 (13.34) | 17 (21.91) | 0.122 |
| PLR | 176.15 (125.51) | 399.55 (341.38) | 0.013 | 291.11 (248.77) | 321.56 (226.84) | 0.387 |
| C reactive protein (mg/dl) | 3.82 (6.29) | 11.33 (6.71) | <0.001 | 12.85 (11.01) | 17.01 (12.47) | 0.040 |
| Urea (mg/dl) | 30.56 (14.32) | 58.15 (36.68) | 0.005 | 52.03 (33.20) | 89.68 (59.08) | <0.001 |
| Creatinine (mg/dl) | 0.93 (0.63) | 1.54 (1.06) | 0.025 | 1.28 (1.28) | 1.77 (1.42) | 0.011 |
| pH | 7.42 (0.06) | 7.38 (0.12) | 0.041 | 7.41 (0.09) | 7.36 (0.15) | 0.01 |
| HCO3 (mmol/L) | 25.06 (2.56) | 23.69 (4.42) | 0.22 | 25.71 (4.13) | 22.57 (6.46) | 0.001 |
| Base deficit (mmol/L) | 1.19 (3.10) | –0.78 (4.62) | 0.025 | 1.70 (4.92) | –2.26 (8.21) | <0.001 |
| Lactate (mmol/L) | 1.50 (0.79) | 1.70 (0.75) | 0.337 | 1.93 (1.63) | 3.81 (3.52) | <0.001 |
| CURB-65 score, n (%) | ||||||
| Low (score 0–1) | 253 (84.8) | 4 (22.2) | <0.001 | 35 (18.2) | 0 <0.001 | |
| Intermediate (score 2) | 41 (11.3) | 4 (22.2) | 67 (34.7) | 7 (11.0) | ||
| High (score 3–5) | 12 (3.9) | 10 (55.6) | 91 (47.1) | 57 (89.0) | ||
| Shock Index | 0.68 (0.12) | 0.68 (0.18) | 0.833 | 0.90 (0.29) | 1.27 (0.43) | <0.001 |
MLR monocyte-to-lymphocyte ratio NLR neutrophil-to-lymphocyte ratio PLR platelet-to-lymphocyte ratio HCO3 bicarbonate CURB confusion, urea nitrogen, respiratory rate, blood pressure
We did a univariate and multivariate logistic regression analysis to determine the role of distinct clinical and analytical variables to predict the 30-day all-cause mortality (Table III). The univariate analysis revealed that each year in age increased the 30-day mortality by 9.9% (95% CI 1.054–1.146) in Covid-19 patients and by 4.8% (95% CI 1.020–1.077) in CAP patients. In Covid-19 patients, a 1-unit increase in MLR, NLR and PLR was associated with ×2.880, ×1.137 and ×1.004 increased mortality, respectively. No significant association was observed in CAP patients regarding to MLR, NLR and PLR levels. A 1-unit increase in SI was found to be associated with increased mortality (×14.756) in CAP patients. A decrease in diastolic blood pressure (DBP) and base deficiency increased the likelihood of mortality in Covid-19 patients. An increase in lactate and a decrease in systolic blood pressure (SBP), DBP, mean arterial pressure (MAP), base deficiency and HCO3 increased the likelihood of mortality in CAP patients.
| Item | Covid-19 | Community-acquired pneumonia | ||||||
|---|---|---|---|---|---|---|---|---|
| Univariate analysis | Multivariate analysis | Univariate analysis | Multivariate analysis | |||||
| p value | OR (95% CI) | p value | OR (95% CI) | p value | OR (95% CI) | p value | OR (95% CI) | |
| Age | <0.001 | 1.09 (1.05–1.14) | 0.041 | 1.05 (1.02–1.10) | <0.001 | 1.048 (1.020–1.077) | 0.002 | 1.05 (1.01–1.11) |
| Gender (ref: women) | 0.072 | 2.63 (0.91–7.56) | 0.561 | 1.197 (0.653–2.193) | ||||
| Shock index | 0.832 | 0.66 (0.01–18.07) | <0.001 | 14.756 (6.161–35.415) | ||||
| Systolic BP | 0.465 | 0.98 (0.97–1.02) | <0.001 | 0.959 (0.942–0.973) | ||||
| Diastolic BP | 0.017 | 0.96 (0.95–0.97) | <0.001 | 0.982 (0.977–0.986) | 0.001 | 0.95 (0.93–0.97) | ||
| MAP | 0.053 | 0.95 (0.91–1.00) | <0.001 | 0.945 (0.921–0.968) | ||||
| MLR | <0.001 | 2.88 (1.61–5.18) | 0.882 | 0.981 (0.717–1.264) | ||||
| NLR | <0.001 | 1.13 (1.08–1.20) | 0.017 | 1.07 (1.01–1.13) | 0.140 | 1.012 (0.996–1.029) | ||
| PLR | <0.001 | 1.00 (1.00–1.00) | 0.389 | 1.000 (0.997–1.002) | ||||
| HCO3 (mmol/L) | 0.078 | 0.86 (0.73–1.01) | <0.001 | 0.877 (0.824–0.937) | ||||
| Base deficit(mmol/L) | 0.032 | 0.85 (0.71–0.92) | <0.001 | 0.894 (0.849–0.940) | ||||
| Lactate (mmol/L) | 0.337 | 1.33 (0.74–2.357) | <0.001 | 1.432 (1.202–1.710) | 0.005 | 1.28 (1.08–1.53) | ||
BP blood pressure MAP mean arterial pressure MLR monocyte-to-lymphocyte ratio NLR neutrophil-to-lymphocyte ratio PLR platelet-to-lymphocyte ratio OR odds ratio CI confidence interval HCO3 bicarbonate
On multivariate analysis, for Covid-19 patients, although age and NLR remained in the final step of the model; age, DBP and lactate were the only parameters that remained in the final step of the model for mortality in CAP patients. We found that in the Covid-19 group each 1-year increase in age and 1-unit increase in NLR would result in an increase by 5% and 7% in the chance of mortality, respectively. In the CAP group, 1-year increase in age, 1-unit increase in lactate and 1-unit decrease in DBP would result in an increase by 5%, 128% and 2%, respectively (Table III).
To predict high acuity level patients (CURB-65 ≥3), we did a univariate and multivariate logistic regression to study the associations between these clinical and laboratory parameters and CURB-65 ≥3. We found a signicant improvement in performance using age, gender, MLR, NLR, PLR and lactate in terms of predicting CURB-65 ≥3 based on univariate analysis in Covid-19 patients. In CAP patients, age, SI, SBP, DBP, MAP, HCO3 and lactate levels were found to have a significant effect in predicting CURB-65 ≥3. In the multivariate analysis age, PLR and lactate remained in the final step of the model for the prediction of CURB-65 ≥3 in Covid-19 patients, whereas age, DBP, HCO3 and lactate remained in the final step of the model for the prediction of CURB-65 ≥3 in CAP patients (Table III).
A ROC curve analysis was done to compare predictive performances of CURB-65, SI, MLR, NLR and PLR (Fig. 2a and b). In Covid-19 patients, CURB-65 (AUC 0.817, p<0.001), MLR (AUC 0.853, p<0.001), NLR (AUC 0.838, p<0.001) and PLR (AUC 0.75, p=0.001) signicantly predicted 30-day mortality. CURB-65 (AUC 0.795, p<0.001) and SI (AUC 0.765, p<0.001) were the only two predictors signicantly associated with 30-day mortality in CAP patients. The difference between AUCs was further tested for the signicance by pairwise comparison of ROC curve analysis. The pairwise comparison for CURB-65 versus MLR (DBA 0.036, p=0.69), CURB-65 versus NLR (DBA 0.021, p=0.804) and CURB-65 versus PLR (DBA –0.067, p=0.527) showed no signicant difference in terms of predicting 30-day mortality in Covid-19 patients. CURB-65 versus SI (DBA –0.030, p=0.216) was the only parameter that showed no significant difference in predicting 30-day mortality in CAP patients (Table V).
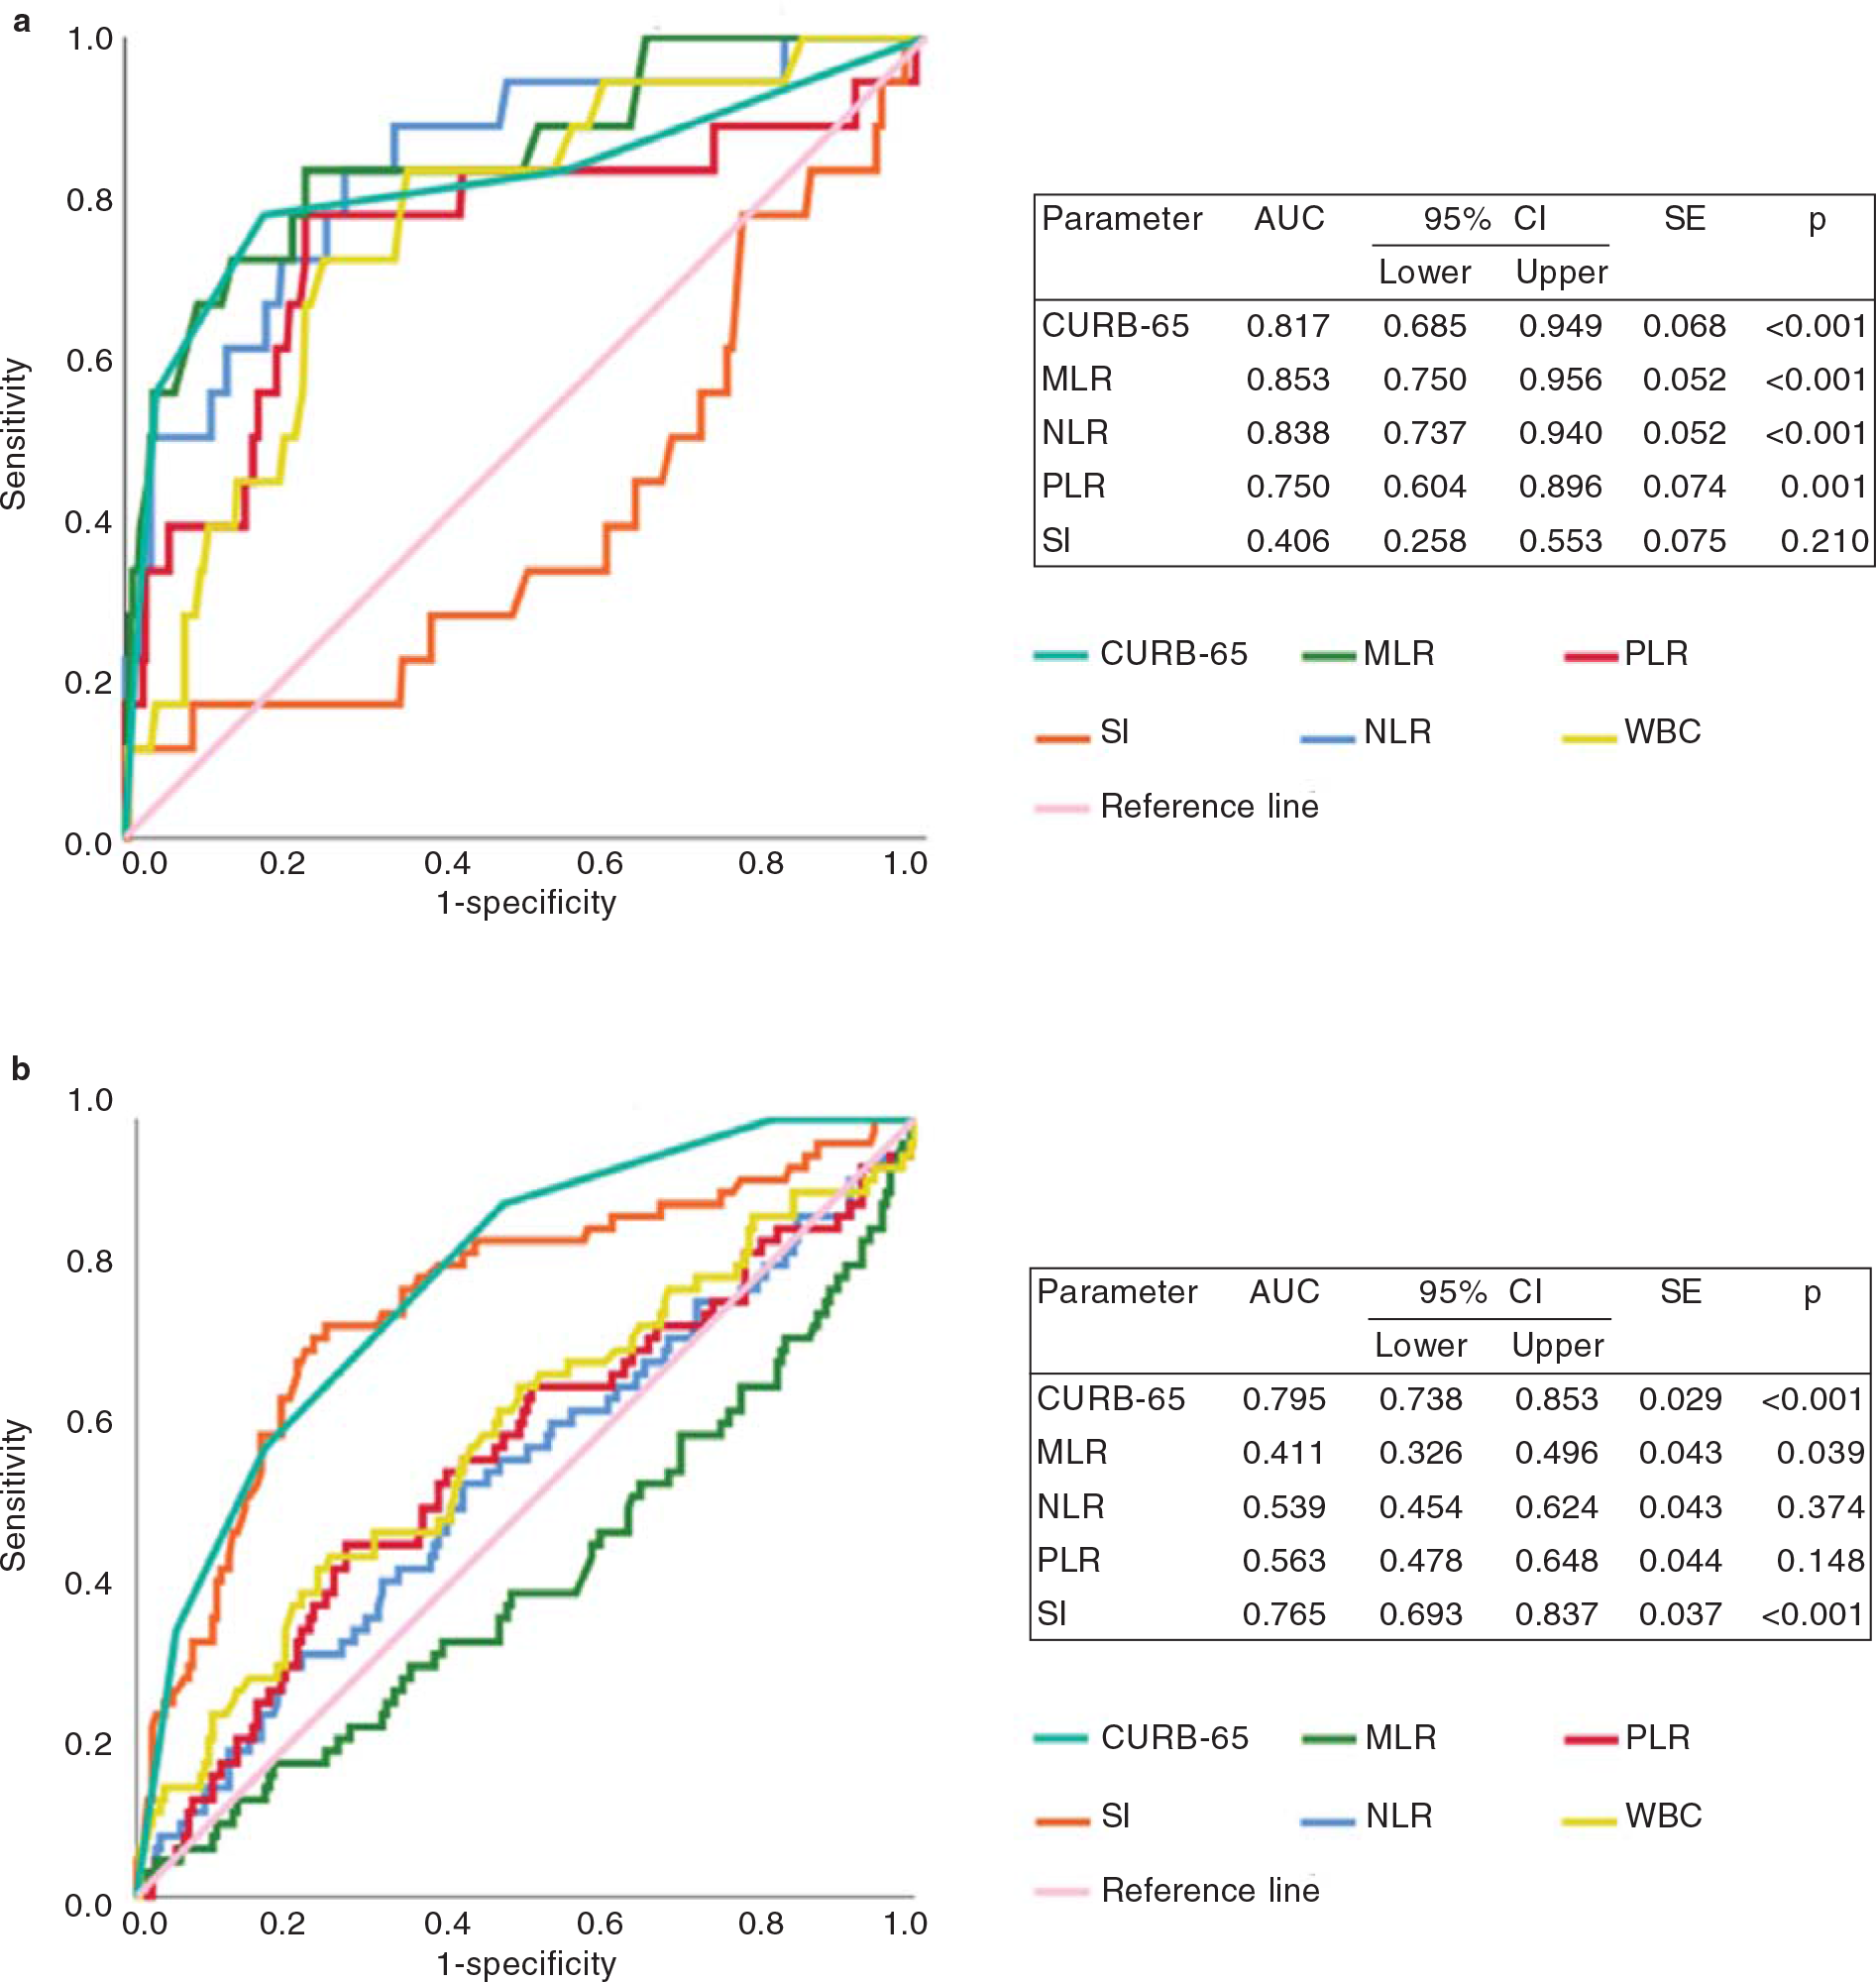
- Receiver operating characteristic (ROC) curves of study parameters to predict 30-day all-cause mortality in pateints with (a) Covid-19 pneumonia and (b) community-acquired pneumonia (CAP) AUC area under the curve CI confidence interval PLR platelet-to-lymphocyte ratio MLR monocyte-to-lymphocyte ratio NLR neutrophil-to-lymphocyte ratio
| Item | Covid-19 | Community-acquired pneumonia | ||||||
|---|---|---|---|---|---|---|---|---|
| Univariate analysis | Multivariate analysis | Univariate analysis | Multivariate analysis | |||||
| p value | OR (95% CI) | p value | OR (95% CI) | p value | OR (95% CI) | p value | OR (95% CI) | |
| Age (years) | <0.001 | 1.15 (1.09–1.20) | <0.001 | 1.16 (1.07–1.26) | <0.001 | 1.06 (1.04–1.09) | 0.002 | 1.08 (1.05–1.12) |
| Gender (ref: women) | 0.006 | 4.74 (1.57–14.35) | 0.857 | 1.05 (0.62–1.87) | ||||
| SI | 0.618 | 0.41 (0.01–13.54) | <0.001 | 1.88 (1.46–2.41) | ||||
| SBP (mm/Hg) | 0.240 | 1.01 (0.94–1.04) | <0.001 | 0.96 (0.94–0.97) | ||||
| DBP (mm/Hg) | 0.265 | 0.97 (0.94–1.01) | <0.001 | 0.92 (0.90–0.94) | <0.001 | 0.95 (0.93–0.97) | ||
| MAP (mm/Hg) | 0.889 | 0.99 (0.96–1.03) | <0.001 | 0.93 (0.91–0.95) | ||||
| MLR | 0.003 | 2.06 (1.27–3.34) | 0.522 | 1.07 (0.85–1.36) | ||||
| NLR | <0.001 | 1.09 (1.04–1.15) | 0.052 | 1.02 (1.00–1.04) | ||||
| PLR | <0.001 | 1.01 (1.01–1.01) | 0.002 | 1.00 (1.00–1.00) | 0.806 | 1.00 (0.99–1.00) | ||
| HCO3 (mmol/L) | 0.077 | 0.87 (0.74–1.01) | 0.049 | 0.94 (0.89–1.00) | 0.049 | 0.80 (0.64–0.99) | ||
| Base deficite (mmol/L) | 0.097 | 0.89 (0.78–1.02) | 0.145 | 0.97 (0.93–1.01) | ||||
| Lactate (mmol/L) | 0.017 | 1.96 (1.13–3.41) | 0.019 | 2.56 (1.15–5.62) | 0.001 | 1.54 (1.20–1.96) | 0.044 | 1.29 (1.08–1.54) |
SBP systolic blood pressure DBP diastolic blood pressure MAP mean arterial pressure MLR monocyte-to-lymphocyte ratio NLR neutrophil-to-lymphocyte ratio PLR platelet-to-lymphocyte ratio SI shock index HCO3 bicarbonate CI confidence interval
| Item | DBA | SE | 95% CI | Z statistic | p value |
|---|---|---|---|---|---|
| Covid-19 | |||||
| CURB-65 versus MLR | 0.036 | 0.347 | –0.141–0.213 | 0.399 | 0.690 |
| CURB-65 versus NLR | 0.021 | 0.346 | –0.147–0.190 | 0.248 | 0.804 |
| CURB-65 versus PLR | –0.067 | 0.378 | –0.276–0.141 | –0.633 | 0.527 |
| CURB-65 versus shock index | –0.412 | 0.380 | –0.622–0.201 | –3.837 | <0.001 |
| Community-acquired pneumonia | |||||
| CURB-65 versus MLR | –0.385 | 0.269 | –0.483–0.286 | –7.666 | <0.001 |
| CURB-65 versus NLR | –0.257 | 0.270 | –0.356–0.158 | –5.085 | <0.001 |
| CURB-65 versus PLR | –0.232 | 0.270 | –0.335–0.130 | –4.459 | <0.001 |
| CURB-65 versus shock index | –0.030 | 0.254 | –0.079–0.018 | –1.237 | 0.216 |
DBA differences between areas SE standard error CI confidence interval MLR monocyte-to-lymphocyte ratio NLR neutrophil-to-lymphocyte ratio PLR platelet-to-lymphocyte ratio CURB confusion, urea nitrogen, respiratory rate, blood pressure
DISCUSSION
We appraised the abilities of distinct risk stratification scoring tools to predict 30-day all-cause mortality and assessed independent predictive factors of mortality in two cohorts of patients with Covid-19 and CAP. We showed that MLR, NLR and PLR levels were elevated in Covid-19 and CAP patients compared to healthy controls. Non-survivor Covid-19 patients had significantly elevated MLR, NLR and PLR levels at admission. Multivariate analysis showed that only NLR levels were associated with all-cause 30-day mortality in patients with Covid-19. Based on pairwise analysis, we suggest that MLR, NLR and PLR are as reliable as CURB-65 in predicting mortality in Covid-19 but not in CAP.
Accurate prediction of mortality can assist with the allocation of scarce healthcare resources and optimize safe and effective patient management. Thus, developing and validating risk scoring systems for mortality prediction can facilitate decision-making in emergency response circumstances.11 The widely used scoring systems such as CURB-65, Sepsis-Related Organ Failure Assessment (SOFA), Pneumonia Severity Index score, and the APACHE score provide a rough estimate of mortality prediction, but the main shortcomings of these models are the questionable specificity and sensitivity with sound clinical judgement for CAP and Covid-19-related pneumonias.12,13 Therefore, it is not surprising to encounter ongoing attempts to develop a prognostic evaluation model that can predict a poor outcome for patients with pneumonia either due to Covid-19 or a non-Covid-19 diagnosis.
CURB-65 scores allow physicians to allocate their patients to the appropriate level and intensity of medical monitoring and perform adequate treatment strategies in time.14 In contrast to the aforementioned scoring systems that require repetitive measures (e.g. SOFA) or necessitates complicated input parameters (e.g. Pneumonia Severity Index and APACHE-II), CURB-65 requires a small number of quickly obtained parameters and has been validated in various patient groups and considered as a strong predictor of mortality in community- or hospital-acquired pneumonia.12 Since the outbreak of Covid-19, several research studies that have examined the accuracy of CURB-65 in predicting mortality among patients presenting to the emergency department showed high values for AUROC.15 Guo et al. reported an excellent discrimination capacity of CURB-65 (AUC 0.81, 95% CI 0.71–0.91) for prediction of 30-day inhospital mortality and suggested that CURB-65 >2 may be used as a cut-off value for prediction of in-hospital death in severe patients with Covid-19.16 In our study, CURB-65 showed a good performance on predicting mortality in Covid-19 (AUROC 0.817, p<0.001) and CAP patients (AUROC 0.795, p<0.001). Pre-Covid studies proposed a score of CURB-65 <2, which was persistently related with low 30-day mortality rates of 0.4%–2.8%.17 The exploration of CURB-65 performance with respect to 30-day mortality prediction in our study suggested that elevated CURB-65 scores have an important role in predicting particularly poor outcomes; CURB-65 scores of ≥3 in CAP patients in the pre-Covid era were found to be associated with increased death rates (89%) compared with just 55.6% in Covid-19 pneumonia.
In recent years, investigators have drawn attention to the importance of various CBC differentials such as MLR, NLR and PLR in the diagnosis and prognosis of many distinct disease conditions including sepsis, coronary artery disease, inflammatory bowel disease, pancreatitis, spontaneous bacterial peritonitis, gynaecological diseases, several tumoral pathologies and Covid-19 pneumonia.5–7 Although most existing studies discuss the predictive value of these ratios separately, only a few focus on the combination of MLR, NLR and PLR in patients with Covid-19. In one of these studies, Fois et al. explored the capacity of different CBC-derived inflammation indexes, including MLR, NLR and PLR, to predict in-hospital mortality.18 Only NLR levels were found to be elevated in non-survivor Covid-19 patients. Similarly, a study from India showed that although leukocytosis, neutrophilia, lymphopenia and monocytosis were characteristic features of Covid-19, NLR and NLR+ red cell distribution width were the most effective single and combination CBC parameters in distinguishing mild to moderate and severe Covid-19 cases.19 In another study from Bastug et al., an increase in MLR, NLR and PLR in severe Covid-19 cases was shown, but only NLR had the highest AUC for predicting severe disease in the ROC curve analysis (AUC 0.861).20
Regarding differential characteristics of white blood cells of our Covid-19 study population, we identified that non-survivors had significantly increased MLR, NLR and PLR levels. Although in our study, according to univariate analysis, all three parameters were found to be associated with mortality in Covid-19 pneumonia, multivariate analysis revealed that after adjusting the other confounding factors, only NLR remained as a predictive factor for Covid-19 associated mortality (adjusted OR 1.07, 95% CI 1.01–1.13). Therefore, we propose that elevated NLR levels may serve as a predictive parameter for severe Covid-19, which has also been shown in several other studies. In this context, a study from Wang et al. showed that NLR of 3.338 was related with all-cause mortality, with a sensitivity and specificity of 100% and 84%, respectively.21 In a meta-analysis by Li et al., 13 studies involving 1579 patients that reported the predictive value of NLR on Covid-19 severity were investigated, and the pooled sensitivity and specificity were found to be 0.78 (95% CI 0.70–0.84, I2 71.83) and 0.78 (95% CI 0.73–0.83, I2 77.80), respectively.22
Accumulating evidence suggests that elevated NLR levels reflects the high systemic inflammatory response which is related with an unfavourable prognosis of infectious diseases.23 Furthermore, severe Covid-19 cases were more likely to have higher neutrophil counts and lower lymphocyte counts when compared with non-severe cases. Although several plausible explanations exist for this finding, the exact pathophysiological mechanism underlying this relationship has not been clarified. One of the most plausible mechanisms explaining this issue is based mainly on the physiological link between neutrophilia and lymphopenia with systemic inflammation and physiological stress response. A further exposition is that neutrophils participate in the antimicrobial host defence as the first line of innate immune defence, whereas lymphocytes are considered as the primary cells that control adaptive immune response.24 In a retrospective analysis of over 450 patients, Qin et al. reported that severe Covid-19 patients are likely to have elevated NLRs caused by the higher neutrophil counts and decreased T cells with lower levels of T helper cells in the severe group proposing that surveillance of NLR and lymphocyte subsets is helpful in the early screening of critical illness, diagnosis and treatment of Covid-19.25 Thus, neutrophilia is found to be a risk factor associated with the development of acute respiratory distress syndrome (ARDS) and progression from ARDS to death in Covid-19 patients.26
Our study has several limitations. First, it is a retrospective analysis of electronic patient files and laboratory tests or vital signs were incomplete in some of the patients so it is possible that some confounders may have been missed. Second, the single-centre setting limits the reproducibility of these indicators and reduces the external validity of our results. Third, several laboratory parameters associated with mortality in Covid-19 patients including D-dimer, ferritin and lactate dehydrogenase were not included in the comparisons because only a small number of patients in the CAP and control group had these investigations done. And finally, the study was not designed to discover pathways that lead to changes in NLR, PLR and MLR as we had no laboratory data about further well-established biomarkers of inflammation to compare our results such as erythrocyte sedimentation rate, tumour necrosis factor-alpha, interleukin (IL)-1 beta, IL-6, IL-8.
Conclusions
Our study suggests that NLR, PLR and MLR can be used for risk stratification compared to CURB-65 in Covid-19 patients. Furthermore, we found that CURB-65 score ≥3 was an important predictor of in-hospital and 30-day mortality. CURB-65 alone should not be used to prognosticate Covid-19 pneumonia since low CURB-65 scores were associated with substantial mortality rates. To achieve a higher prediction accuracy, the focus should be on developing relevant indicators that enable the deployment of well-validated high-throughput predictive models and prospective evaluation of their effectiveness.
Conflicts of interest
None declared
References
- Development and validation of a simple risk score for diagnosing COVID-19 in the emergency room. Epidemiol Infect. 2020;148:e273.
- [CrossRef] [PubMed] [Google Scholar]
- The usefulness of confusion, urea, respiratory rate, and shock index or adjusted shock index criteria in predicting combined mortality and/or ICU admission compared to CURB-65 in community-acquired pneumonia. Biomed Res Int. 2013;2013:590407.
- [CrossRef] [PubMed] [Google Scholar]
- Performance of the CURB-65 score in predicting critical care interventions in patients admitted with community-acquired pneumonia. Ann Emerg Med. 2019;74:60-8.
- [CrossRef] [PubMed] [Google Scholar]
- Neutrophil to lymphocyte ratio, lymphocyte to monocyte ratio and platelet to lymphocyte ratio to predict the severity of COVID-19. Am J Emerg Med. 2020;40:110-14.
- [CrossRef] [PubMed] [Google Scholar]
- Assessment of neutrophil-lymphocyte ratio in ulcerative colitis: A promising marker in predicting disease severity. Clin Res Hepatol Gastroenterol. 2012;36:491-7.
- [CrossRef] [PubMed] [Google Scholar]
- Platelet to lymphocyte ratio can be a predictor of infarct-related artery patency in patients with ST-segment elevation myocardial infarction. Angiology. 2015;66:831-6.
- [CrossRef] [PubMed] [Google Scholar]
- Systemic immune-inflammation index (SII): A more promising inflammation-based prognostic marker for patients with synchronic colorectal peritoneal carcinomatosis. J Cancer. 2020;11:5264-72.
- [CrossRef] [PubMed] [Google Scholar]
- Defining community acquired pneumonia severity on presentation to hospital: An international derivation and validation study. Thorax. 2003;58:377-82.
- [CrossRef] [PubMed] [Google Scholar]
- G*Power 3: A flexible statistical power analysis program for the social, behavioral, and biomedical sciences. Behav Res Methods. 2007;39:175-91.
- [CrossRef] [PubMed] [Google Scholar]
- Comparing the areas under two or more correlated receiver operating char-acteristic curves: A nonparametric approach. Biometrics. 1988;44:837-45.
- [CrossRef] [PubMed] [Google Scholar]
- Mortality prediction model for the triage of COVID-19, pneumonia, and mechanically ventilated ICU patients: A retrospective study. Ann Med Surg (Lond). 2020;59:207-16.
- [CrossRef] [PubMed] [Google Scholar]
- Validation of pneumonia prognostic scores in a statewide cohort of hospitalised patients with COVID-19. Int J Clin Pract. 2021;75:e13926.
- [CrossRef] [Google Scholar]
- Serial evaluation of the SOFA score to predict outcome in critically ill patients. JAMA. 2001;286:1754-8.
- [CrossRef] [PubMed] [Google Scholar]
- Metabolic profiles in community-acquired pneumonia: Developing assessment tools for disease severity. Crit Care. 2018;22:130.
- [CrossRef] [PubMed] [Google Scholar]
- Predicting 30-day mortality of patients with pneumonia in an emergency department setting using machine-learning models. Clin Exp Emerg Med. 2020;7:197-205.
- [CrossRef] [PubMed] [Google Scholar]
- CURB-65 may serve as a useful prognostic marker in COVID-19 patients within Wuhan, China: A retrospective cohort study. Epidemiol Infect. 2020;148:e241.
- [CrossRef] [PubMed] [Google Scholar]
- Severity assessment tools for predicting mortality in hospitalised patients with community-acquired pneumonia. Systematic review and meta-analysis. Thorax. 2010;65:878-83.
- [CrossRef] [PubMed] [Google Scholar]
- The systemic inflammation index on admission predicts in-hospital mortality in COVID-19 patients. Molecules. 2020;25:E5725.
- [CrossRef] [PubMed] [Google Scholar]
- Association of Hematologic biomarkers and their combinations with disease severity and mortality in COVID-19-an Indian perspective. Am J Blood Res. 2021;11:180-90.
- [Google Scholar]
- Clinical and laboratory features of COVID-19: Predictors of severe prognosis. Int Immunopharmacol. 2020;88:106950.
- [CrossRef] [PubMed] [Google Scholar]
- Ratios of neutrophil-tolymphocyte and platelet-to-lymphocyte predict all-cause mortality in inpatients with coronavirus disease 2019 (COVID-19): A retrospective cohort study in a single medical centre. Epidemiol Infect. 2020;148:e211.
- [CrossRef] [PubMed] [Google Scholar]
- Predictive values of neutrophilto-lymphocyte ratio on disease severity and mortality in COVID-19 patients: A systematic review and meta-analysis. Crit Care. 2020;24:647.
- [CrossRef] [PubMed] [Google Scholar]
- Inflammation biomarkers in blood as mortality predictors in community-acquired pneumonia admitted patients: Importance of comparison with neutrophil count percentage or neutrophil-lymphocyte ratio. PLoS One. 2017;12:e0173947.
- [CrossRef] [PubMed] [Google Scholar]
- Higher level of neutrophil-to-lymphocyte is associated with severe COVID-19. Epidemiol Infect. 2020;148:e139.
- [CrossRef] [PubMed] [Google Scholar]
- Dysregulation of immune response in patients with coronavirus 2019 (COVID-19) in Wuhan, China. Clin Infect Dis. 2020;71:762-8.
- [CrossRef] [PubMed] [Google Scholar]
- Early prediction and identification for severe patients during the pandemic of COVID-19: A severe COVID-19 risk model constructed by multivariable logistic regression analysis. J Glob Health. 2020;10:20510.
- [CrossRef] [PubMed] [Google Scholar]