Translate this page into:
Prevalence of anaemia among adolescent girls (10–19 years) in India: A systematic review and meta-analysis
Correspondence to SANJEEV GUPTA; sgupta_91@yahoo.co.in
[To cite: Daniel RA, Kalaivani M, Kant S, Gupta S. Prevalence of anaemia among adolescent girls (10–19 years) in India: A systematic review and meta-analysis. Natl Med J India 2023;36:233–40. DOI: NMJI_637_21]
Abstract
Background
Anaemia is a serious public health problem. It is the second-commonest contributing factor to years lost by adolescents to disability and death. Targeting adolescent girls will allow a window of opportunity to correct their nutritional health and improve their obstetric outcomes. Studies in India have reported varying prevalence rates of anaemia among adolescent girls. Hence, we did a systematic review and meta-analysis of community-based studies to obtain a comprehensive pooled estimate of the prevalence of anaemia among adolescent girls in India.
Methods
We did a systematic electronic search in PubMed, Embase, Cochrane Library and Google scholar to retrieve community-based studies that reported the prevalence of anaemia among adolescent girls (10–19 years) in India, without any date or language restriction. To estimate the pooled prevalence and heterogeneity, the random-effects model and I2 statistical methods were used. We did subgroup analyses based on geographical region, study setting, method used to measure haemoglobin concentration, and year of publication.
Results
We included 35 studies in this meta-analysis comprising 152 640 participants. The pooled prevalence of anaemia among adolescent girls was 65.7% (95% CI 59.3%– 71.9%). There was significant heterogeneity between the studies (I2 99.6%; p<0.001).
Conclusion
There is a high prevalence of anaemia among adolescent girls in India. While all regions of the country have a high prevalence, tribal areas need special attention. Targeted actions need to focus on the identification of determinants of anaemia apart from iron supplementation.
INTRODUCTION
Anaemia is a state in which the hemoglobin (Hb) level and/or red blood cells are insufficient to cope with the body’s physiological needs. Globally, iron deficiency is the most common reason for anaemia.1 It is a major public health problem that had affected 1.9 billion people globally in 2017. It is also a leading cause of impairment, with 58.2 million years lived with disability.2 Though present widely across the globe, it is more pronounced in low- and middle-income countries. In India, it mainly affects women of reproductive age group, lactating women, children and adolescent girls.3
India is home to 243 million adolescents, comprising 21.4% of the country’s population. Adolescence (10–19 years) is a unique phase of life where they experience brisk physical, cognitive and psychosocial growth.4 In 2016, worldwide, the second leading cause of years lost by adolescents to death and disability was iron deficiency anaemia.4 The major health consequences of anaemia among adolescents are poor cognition, concentration, memory and scholastic performance, low immunity, recurrent infections, poor motor development outcomes, and irregular menstruation.5 Adolescent girls are a priority age group since they may be on the verge of motherhood. Also, depletion of body iron reserve in women begins during the adolescent phase with the commencement of menstruation.
In Asia, anaemia is the second leading cause of maternal mortality.6 Added to this, the leading cause of death among girls aged 15–19 years is complications from pregnancy and childbirth. Girls who become pregnant during adolescence will have a poor obstetric outcome as they are physically immature.7 Hence, targeting anaemia, especially in adolescent girls, improves not only their health status, but also their pregnancy outcomes.
In India, malnutrition in the form of anaemia is prevalent in over 56% of adolescent girls and 30% of adolescent boys.8,9 Studies conducted to estimate the prevalence of anaemia among adolescent girls in India have reported a wide range (21% to 96%).10,11 This wide range could be due to differences in sample size, participants’ characteristics, inclusion and exclusion criteria, study setting, tool used to measure haemoglobin concentration, etc. The quality of individual studies also vary considerably. Hence, we conducted a systematic review and meta-analysis to estimate the pooled prevalence of anaemia among adolescent girls in India.
METHODS
Data sources and search strategy
A comprehensive literature search was done to identify relevant studies published between their inception to 1 August 2021. The following electronic databases were searched: Medline via PubMed, Embase, Cochrane library and Google Scholar with no restriction on language using Medical Subject Headings (MeSH) and keywords. The keywords used to build the search strategy were: ‘prevalence’, ‘epidemiology’, ‘anaemia’, ‘hemoglobin’, ‘hematocrit’, ‘adolescent girls’, and ‘India’. We used the PRISMA (Preferred Reporting Items for Systematic reviews and Meta-Analyses) and Meta-analysis of Observational Studies in Epidemiology (MOOSE) statements as a guide for this study.12,13 We also reviewed cross-references of the published primary studies.
Selection criteria
The following criteria were used for eligibility of studies: (i) population/community-based studies; (ii) conducted among adolescent girls (10–19 years); (iii) should have estimated the prevalence of anaemia; (iv) estimation of hemoglobin should be based on an objective method; (v) data should be sufficient to obtain the prevalence of anaemia among 10–19 years age group; and (vi) studies conducted in India. The exclusion criteria were as follows: (i) studies assessing anaemia among adolescents with specific conditions such as HIV/tuberculosis, chronic kidney disease, etc. because they might show higher than expected prevalence and thus, selection bias and (ii) abstracts, conference proceedings, letters, review articles, editorials, case reports and studies not conducted on humans.
Selection of studies
Two independent reviewers (RAD and SKG) screened all the titles and abstracts of retrieved records from the databases. Only those abstracts that fulfilled the selection criteria were chosen for the full-text review. Disagreements regarding the selection of studies were discussed and resolved. After verifying the most recent and complete version, the duplicates were excluded. Reference lists of the retrieved studies were searched (additional sources). The retrieved full-text studies were judged further to confirm whether they satisfied the inclusion criteria.
Data extraction
We devised a data collection form in Microsoft Excel 2013 to extract and enter the relevant data fields from the selected full- text studies. The following data were extracted from each study: author information, year of publication, place of study, study setting, sampling strategy, sample size, method of estimation of haemoglobin, criteria used to classify anaemia, and the reported prevalence of anaemia. Quality assessment of the selected studies was done based on the CASP (Critical Appraisal Skills Programme) checklist.14
Statistical analysis
We provided summary estimates of the prevalence of anaemia among adolescent girls. The standard error (SE) of the prevalence was calculated from the prevalence and the sample size for each of the studies, using the formula ‘square root of p×(1–p)/n’. Forest plots were created to display the prevalence with a corresponding 95% CI. The meta-analysis was performed by package metan15 in STATA 13.0 (Stata Corp LP, College Station, Texas, USA) using random effects model, weighted by the inverse of the variance. I2 statistic (percentage of residual variation attributed to heterogeneity) was performed to evaluate heterogeneity. Publication bias was assessed by visual inspection of the funnel plot, and the small-study effect was assessed by Egger test. To investigate the observed heterogeneity, subgroup analysis was done based on geographical region, study setting, the method used to estimate haemoglobin concentration and year of publication. Sensitivity analysis was conducted to assess the changes in pooled estimates after removing two large nationally representative surveys. Test of interaction was also done to determine if any significant difference was present in the prevalence of anaemia between subgroups.
RESULTS
Study selection
Overall, 995 studies were retrieved from electronic databases. After removing 103 duplicates, 892 studies were screened based on titles and abstracts using the selection criteria, and 839 were excluded. Of the remaining 53 studies, 18 were excluded, and finally, 35 studies satisfied the inclusion criteria, and were included in the meta-analysis (Fig. 1).

- Flow of selection of studies for meta-analysis
Characteristics of studies included in the meta-analysis
The studies included in this review yielded a combined total of 152 640 adolescents (aged 10–19 years) with a mean age of 14.6 years. The majority of studies included in this review were rural- based and from southern India. There were three multicentre studies,16 of which two were nationally representative surveys.17,18 Of 35 studies included in this review, all were cross- sectional studies except three conducted by Deshmukh et al.,19 Patil et al.20 and Shah et al.,21 which were interventional studies. All except four studies included in this review had adopted the WHO criteria for the classification of anaemia (Hb <12 g/dl).22 Four studies, conducted by Rajaratnam et al.,23 Gupta et al.,24 Sulakshana et al.,25 Shinde et al.,26 had not mentioned the cut- off used to classify anaemia. The majority of studies used simple random sampling to recruit the participants (Table I).
| Author | Year of publication |
Place | Study setting |
Age group | Sample size | Prevalence (%) |
|---|---|---|---|---|---|---|
| Rajaratnam et al.23 | 2000 | Vellore, Tamil Nadu | Rural | 13–19 | 288 | 44.8 |
| Rawat et al.27 | 2001 | Meerut, Uttar Pradesh | Rural | 10–18 | 504 | 34.5 |
| Rao et al.28 | 2003 | Jabalpur, Madhya Pradesh | Tribal | 11–19 | 377 | 86.5 |
| Choudhary et al.29 | 2006 | Vellore, Tamil Nadu | Urban | 11–18 | 100 | 29.0 |
| Kaur et al.30 | 2006 | Sewagram, Maharashtra | Rural | 13–19 | 630 | 59.8 |
| Singh et al.31 | 2006 | Lucknow, Uttar Pradesh | Urban | 10–19 | 400 | 56.0 |
| Toteja et al.16 | 2006 | Multicentric study | Mixed | 11–18 | 4337 | 90.1 |
| Bulliyya et al.11 | 2007 | Khurda, Jajpur, Bargarh, Odisha | Rural | 11–19 | 1937 | 96.5 |
| Chaudhary and Dhage32 | 2008 | Nagpur, Maharashtra | Urban | 10–19 | 296 | 35.1 |
| Deshmukh et al.19 | 2008 | Nashik, Maharashtra | Mixed | 14–18 | 360 | 65.3 |
| Patil et al.33 | 2009 | Ratnagiri, Maharashtra | Rural | 10–19 | 620 | 41.9 |
| Dongre et al.34 | 2011 | Wardha, Maharashtra | Rural | 12–19 | 260 | 73.8 |
| Shivaramakrishna et al.35 | 2011 | Kolar, Karnataka | Rural | 10–19 | 230 | 34.8 |
| Kulkarni et al.36 | 2012 | Jaitala, Maharashtra | Urban | 13–19 | 208 | 88.5 |
| Amarnath and Lakshmanrao37 | 2013 | Visakhapatnam, Andhra Pradesh | Tribal | 10–19 | 270 | 88.9 |
| Pattnaik et al.38 | 2013 | Bhubaneswar, Odisha | Rural | 10–19 | 151 | 79.0 |
| Gupta et al.24 | 2014 | Meerut, Uttar Pradesh | Urban | 10–19 | 216 | 52.8 |
| Patil et al.20 | 2014 | Satara, Maharashtra | Urban | 11–18 | 103 | 85.4 |
| Sulakshana et al.25 | 2014 | Belgaum, Karnataka | Rural | 10–19 | 410 | 75.0 |
| Kappala et al.39 | 2014 | Bellary, Karnataka | Urban | 10–19 | 400 | 82.5 |
| Kumar et al.40 | 2015 | Rajahmundry, Andhra Pradesh | Rural | 11–18 | 215 | 63.7 |
| Phuljhele et al.41 | 2015 | Raipur, Chhattisgarh | Urban | 10–19 | 385 | 61.0 |
| Shinde et al.26 | 2015 | Bhopal, Madhya Pradesh | Urban | 10–19 | 267 | 52.1 |
| NFHS-417 | 2016 | Multicentric study | Mixed | 15–19 | 117 711 | 54.1 |
| Shah et al.21 | 2016 | Jhagadia, Gujarat | Tribal | 10–19 | 117 | 79.5 |
| Siva et al.10 | 2016 | Kottayam, Kerala | Rural | 10–19 | 257 | 21.0 |
| Ahankari et al.42 | 2017 | Marathwada, Maharashtra | Rural | 13–17 | 1010 | 87.0 |
| Raj and Chopra43 | 2017 | Belkhera, Madhya Pradesh | Rural | 10–19 | 200 | 52.5 |
| Srivastava et al.44 | 2017 | Amroha, Uttar Pradesh | Rural | 13–19 | 604 | 69.2 |
| Arya et al.45 | 2017 | Kanpur, Uttar Pradesh | Rural | 10–19 | 400 | 78.5 |
| CNNS18 | 2018 | Multicentric study | Mixed | 10–19 | 17 965 | 39.6 |
| Pareek and Ojha46 | 2018 | Jaipur, Rajasthan | Rural | 12–15 | 472 | 73.7 |
| Kulkarni et al.47 | 2019 | Palghar, Maharashtra | Tribal | 12–18 | 240 | 92.7 |
| Gayakwad and Shankar48 | 2019 | Bagalkot, Karnataka | Urban | 10–19 | 400 | 63.3 |
| Reshmi and Takalkar49 | 2020 | Narketpally, Telangana | Rural | 10–19 | 300 | 59.0 |
NFHS National Family Health Survey CNNS Comprehensive National Nutrition Survey
Pooled estimate of prevalence of anaemia among adolescent girls in India
The prevalence of anaemia among adolescents from the 35 included studies ranged from 21% in a cross-sectional study done by Siva et al.10 in southern India to 96.5% by Bulliyya et al.11 conducted in eastern India. The random effects pooled estimate for the prevalence of anaemia among adolescent girls was 65.7% (95% CI 59.3%–71.9%; Fig. 2). There was significant heterogeneity between the studies. Heterogeneity test showed I2 value of 99.6% and p<0.001.
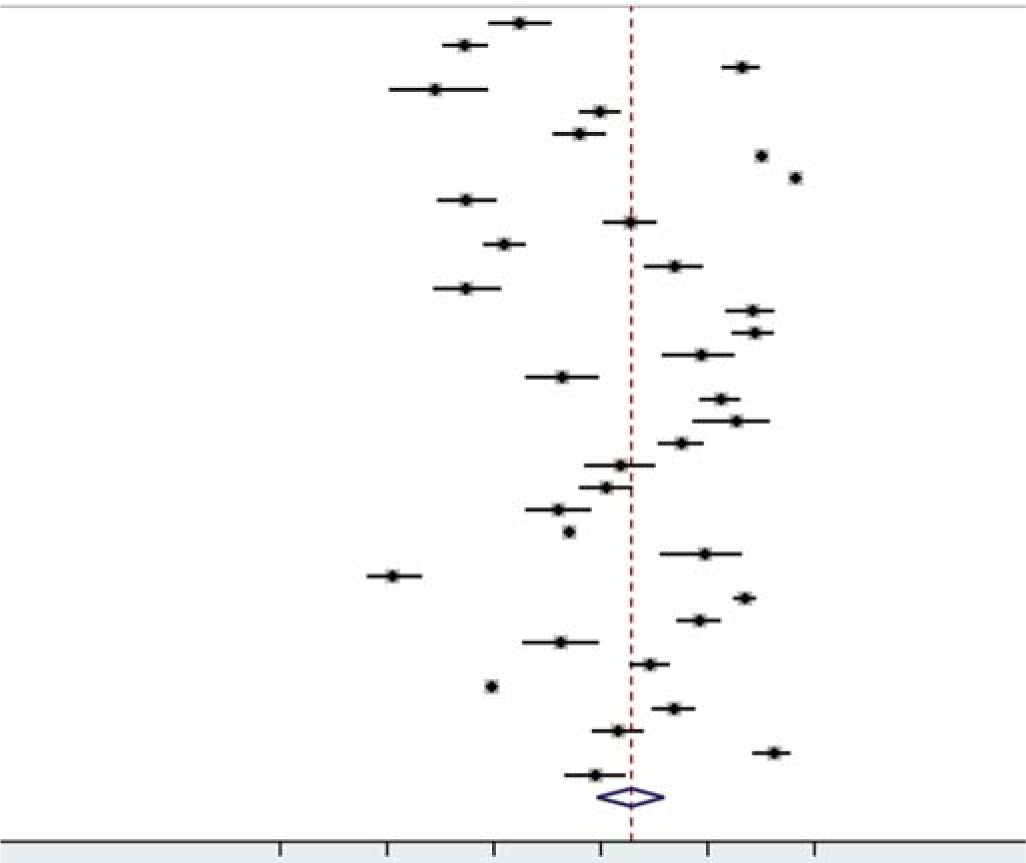
- Forest plot of the meta-analysis for prevalence of anaemia
Subgroup analysis
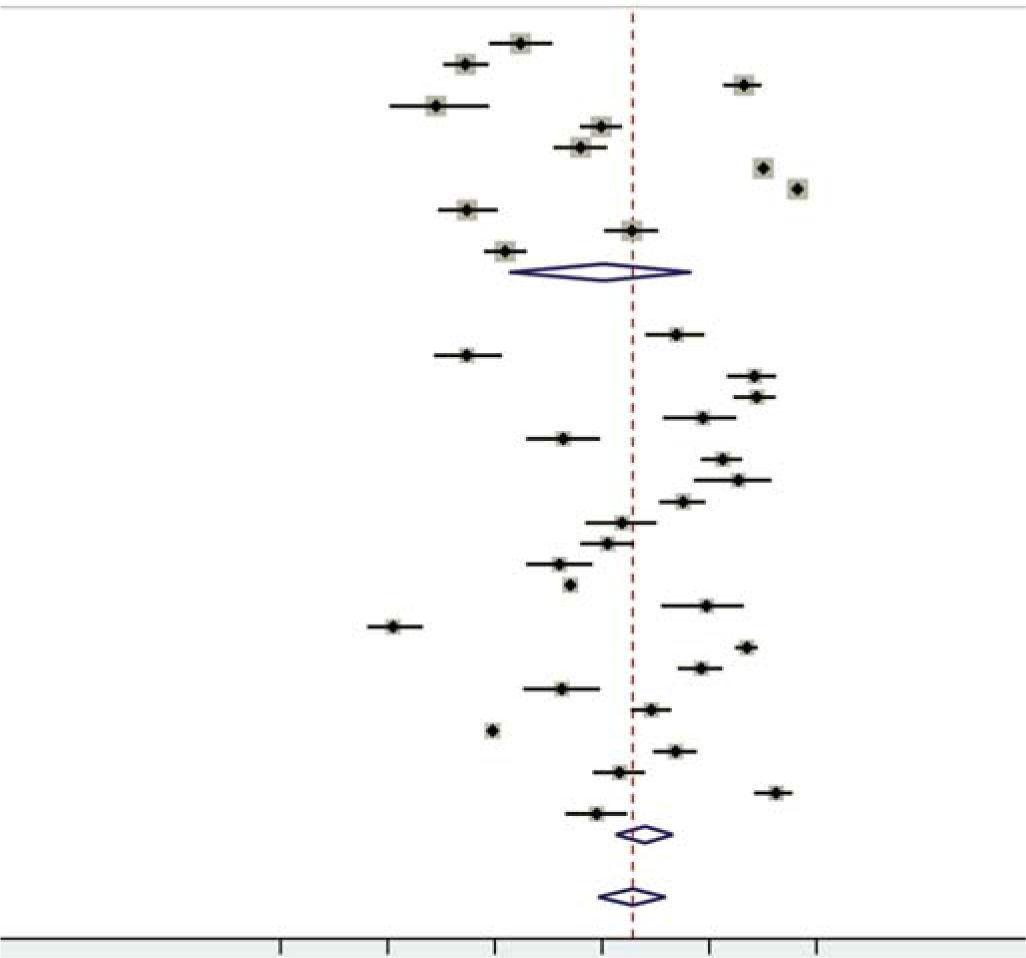
Prevalence of anaemia based on geographical region. Of the 35 included studies, 10 each were conducted in the South and West, nine studies in Central, two studies in the East, and one study in the North region of India. Since there were only two studies from the East, we combined them with North for the sub- group analysis. The prevalence of anaemia in South, West, Central and North with East regions was 57.0%, 72.4%, 61.0% and 84.8%, respectively. There was no significant difference in the heterogeneity between the studies based on geographical region (Fig. 3; p=0.121). We did not include three multicentric studies (Toteja et al., NFHS-4 and CNNS) in this subgroup analysis.

- Forest plot of the meta-analysis for prevalence of anaemia based on geographical region
Prevalence of anaemia based on study setting. Among the 35 included studies, 17 were conducted in rural areas, 10 in urban areas, and 4 in tribal areas. The study by Deshmukh et al.19 was conducted in rural, tribal and urban slums, whereas other studies by Toteja et al., NFHS-4 and CNNS16–18 obtained samples from urban and rural populations. These four studies have been categorized under a ‘mixed’ group. The prevalence of anaemia in rural, urban, tribal and mixed areas were 62.7%, 61.6%, 87.5% and 63.8%, respectively. We observed a small decrease in heterogeneity among studies from the tribal area of India. There was a significant difference in the heterogeneity between the studies based on setting (Fig. 4; p<0.001).
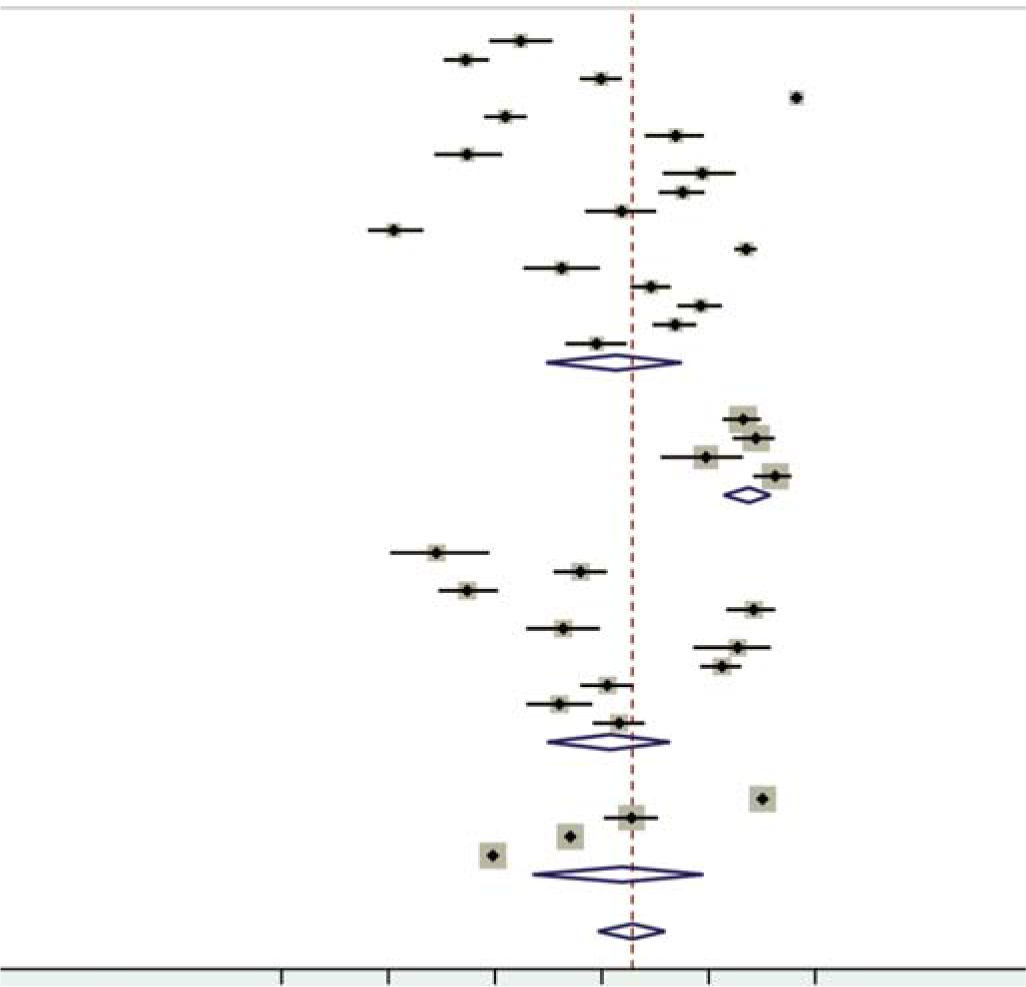
- Forest plot of the meta-analysis for prevalence of anaemia based on study setting
Prevalence of anaemia based on year of publication. Of the 35 studies, 11 were published between 2000 and 2010, and 24 studies were published between 2011 and 2020. The prevalence of anaemia in these two time periods was 60.3% and 68.0%, respectively. We did not observe any decrease in heterogeneity in this subgroup. There was no significant difference in the heterogeneity between the studies based on these two time periods (Fig. 5; p=0.398).
- Forest plot of the meta-analysis for prevalence of anaemia based on year of publication
Prevalence of anaemia based on method of haemoglobin estimation. Of the 35 included studies, 14 used the cyanmethae-moglobin method, 11 used Sahli haemoglobino- meter, 3 used Hemocue, 3 an autoanalyser and 2 a haemoglobin colour scale (HCS). Two studies by Choudhary et al.29 and Raj and Chopra,43 had not mentioned the method used to estimate haemoglobin. For the subgroup analysis, apart from Sahli and cyanmethaemoglobin methods, we combined the remaining methods under the heading ‘others’. The prevalence of anaemia among Sahli, cyanmethaemoglobin, and others was 69.2%, 67.6%, 58.4%, respectively. We did not observe any decrease in heterogeneity in this sub-group. There was no significant difference in the heterogeneity between the studies based on the method used for haemo- globin estimation (Fig. 6; p=0.388).
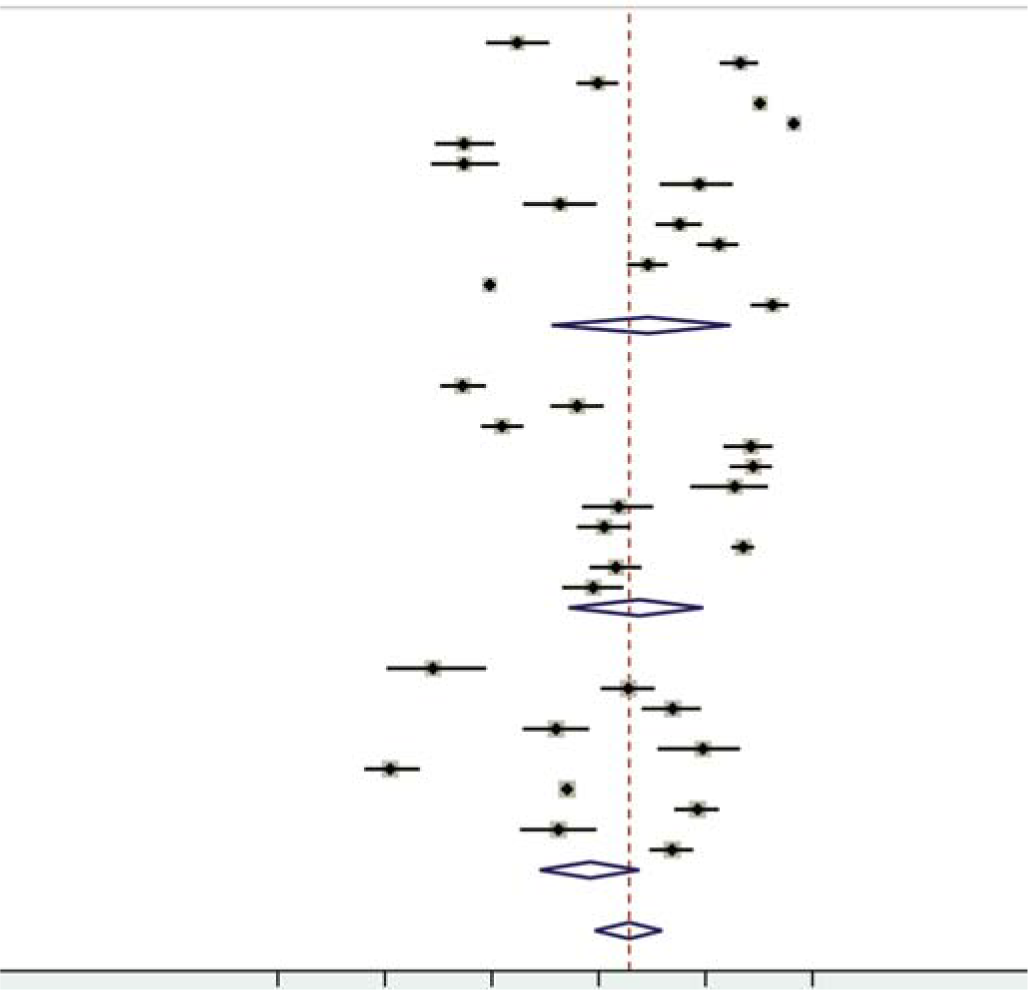
- Forest plot of the meta-analysis for prevalence of anaemia based on method of haemoglobin estimation
Quality assessment
Across the nine quality domains evaluated, most of the studies met six or more of the quality criteria (Table II). Only one study mentioned confidence intervals in their main results. The response rate was satisfactory for all the included studies. Of the 35 studies, 23 studies had calculated the required minimum sample size a priori. Two studies did not clearly explain the methods of participant selection. Two studies had included participants that could not be representative of the population to which the findings were referred.
| Question | Rajaratnam et al.23 |
Rawat et al.27 |
Rao et al.28 | Choudhary et al.29 |
Kaur et al.30 |
Singh et al.31 |
Toteja et al.16 |
Bulliyya et al.11 |
Chaudhary and Dhage32 |
|
| Did the study address a clearly focused question/issue? |
Yes | Yes | Yes | Yes | Yes | Yes | Yes | Yes | Yes | |
| Was the research method (study design) appro- priate for answering the research question? |
Yes | Yes | Yes | Yes | Yes | Yes | Yes | Yes | Yes | |
| Was the method of selection of the participants (employees, teams, divisions, organizations) clearly described? |
Yes | Yes | Yes | Yes | Yes | No | Yes | Yes | Yes | |
| Could the way the sample was obtained introduce (selection) bias? |
No | No | No | No | No | Can’t say | No | No | No | |
| Was the sample of participants representative with regard to the population to which the findings will be referred? |
Yes | Yes | Yes | Yes | Yes | Can’t say | Yes | Yes | Yes | |
| Was the sample size based on pre-study considerations of statistical power? |
No | No | No | Yes | Yes | No | Yes | Yes | Yes | |
| Was a satisfactory response rate achieved? | Yes | Yes | Yes | Yes | Yes | Yes | Yes | Yes | Yes | |
| Were the measurements (questionnaires) likely to be valid and reliable? |
Yes | Yes | Yes | Yes | Yes | Can’t say | Yes | Yes | Yes | |
| Were confidence intervals given for the main results? | No | No | No | No | No | No | No | No | No | |
| Question | Deshmukh et al.19 |
Patil et al.33 | Dongre et al.34 | Shivaramakrishna et al.35 | Kulkarni et al.36 | Amarnath and Lakshmanrao37 |
Pattnaik et al.38 | Gupta et al.24 |
Patil et al.20 |
|
| Did the study address a clearly focused Yes question/issue? |
Yes | Yes | Yes | Yes | Yes | Yes | Yes | Yes | Yes | |
| Was the research method (study design) Yes appropriate for answering the research question? |
Yes | Yes | Yes | Yes | Yes | Yes | Yes | Yes | Yes | |
| Was the method of selection of the Yes participants (employees, teams, divi- sions, organizations) clearly described? |
Yes | Yes | Yes | Yes | Yes | Yes | Yes | Yes | Yes | |
| Could the way the sample was obtained No introduce (selection) bias? |
No | No | No | No | No | No | No | No | No | |
| Was the sample of participants represen- tative with regard to the population to which the findings will be referred? |
Yes | Yes | Yes | Yes | Yes | Yes | Yes | Yes | Yes | |
| Was the sample size based on pre-study considerations of statistical power? | Yes | No | No | Yes | Yes | Yes | No | Yes | No | |
| Was a satisfactory response rate achieved? | Yes | Yes | Yes | Yes | Yes | Yes | Yes | Yes | Yes | |
| Were the measurements (questionnaires) likely to be valid and reliable? | Yes | Yes | Yes | Yes | Yes | Yes | Yes | Yes | Yes | |
| Were confidence intervals given for the main results? | No | No | No | No | No | No | No | No | No | |
| Question | Sulakshana et al.25 |
Kappala et al.39 |
Kumar et al.40 |
Phuljhele et al.41 |
Shinde et al.26 |
NFHS-417 | Shah et al.21 |
Siva et al.10 |
Ahankari et al.42 |
Raj and Chopra43 |
| Did the study address a clearly focused question/issue? |
Yes | Yes | Yes | Yes | Yes | Yes | Yes | Yes | Yes | Yes |
| Was the research method (study design) appropriate for answering the research question? |
Yes | Yes | Yes | Yes | Yes | Yes | Yes | Yes | Yes | Yes |
| Was the method of selection of the participants (employees, teams, divisions, organizations) clearly described? |
Yes | Yes | Yes | Yes | Yes | Yes | Yes | Yes | Yes | Yes |
| Could the way the sample was obtained introduce (selection) bias? |
No | No | No | No | No | No | No | No | No | No |
| Was the sample of participants representa- tive with regard to the population to which the findings will be referred? |
Yes | Yes | Yes | Yes | Yes | Yes | Yes | Yes | Yes | Yes |
| Was the sample size based on pre-study considerations of statistical power? |
No | Yes | Yes | Yes | Yes | Yes | No | Yes | No | No |
| Was a satisfactory response rate achieved? | Yes | Yes | Yes | Yes | Yes | Yes | Yes | Yes | Yes | Yes |
| Were the measurements (questionnaires) likely to be valid and reliable? | Yes | Yes | Yes | Yes | Yes | Yes | Yes | Yes | Yes | Yes |
| Were confidence intervals given for the main results? |
No | Yes | No | No | No | No | No | No | No | No |
| Question | Srivastava et al.44 |
Arya et al.45 |
CNNS18 | Pareek and Ojha46 |
Kulkarni et al.47 |
Gayakwad and Shankar48 |
Reshmi and Takalkar49 |
|||
| Did the study address a clearly focused question/issue? | Yes | Yes | Yes | Yes | Yes | Yes | Yes | |||
| Was the research method (study design) appropriate for answering the research question? | Yes | Yes | Yes | Yes | Yes | Yes | Yes | |||
| Was the method of selection of the participants (employees, teams, divisions, organizations) clearly described? | Yes | Yes | Yes | No | Yes | Yes | Yes | |||
| Could the way the sample was obtained introduce (selection) bias? | No | No | No | Can’t say | No | No | No | |||
| Was the sample of participants representative with regard to the population to which the findings will be referred? | Yes | Yes | Yes | Can’t say | Yes | Yes | Yes | |||
| Was the sample size based on pre-study considerations of statistical power? | Yes | Yes | Yes | Yes | Yes | Yes | Yes | |||
| Was a satisfactory response rate achieved? | Yes | Yes | Yes | Yes | Yes | Yes | Yes | |||
| Were the measurements (questionnaires) likely to be valid and reliable? | Yes | Yes | Yes | Can’t say | Yes | Yes | Yes | |||
| Were confidence intervals given for the main results? | No | No | No | No | No | No | No | |||
NFHS-4 National Family Health Survey–4 CNNS Comprehensive National Nutritional Survey
Publication bias
The funnel plot showed a mild asymmetry (Fig. 7). However, the p value for Egger test was 0.226, implying no or undetected publication bias.
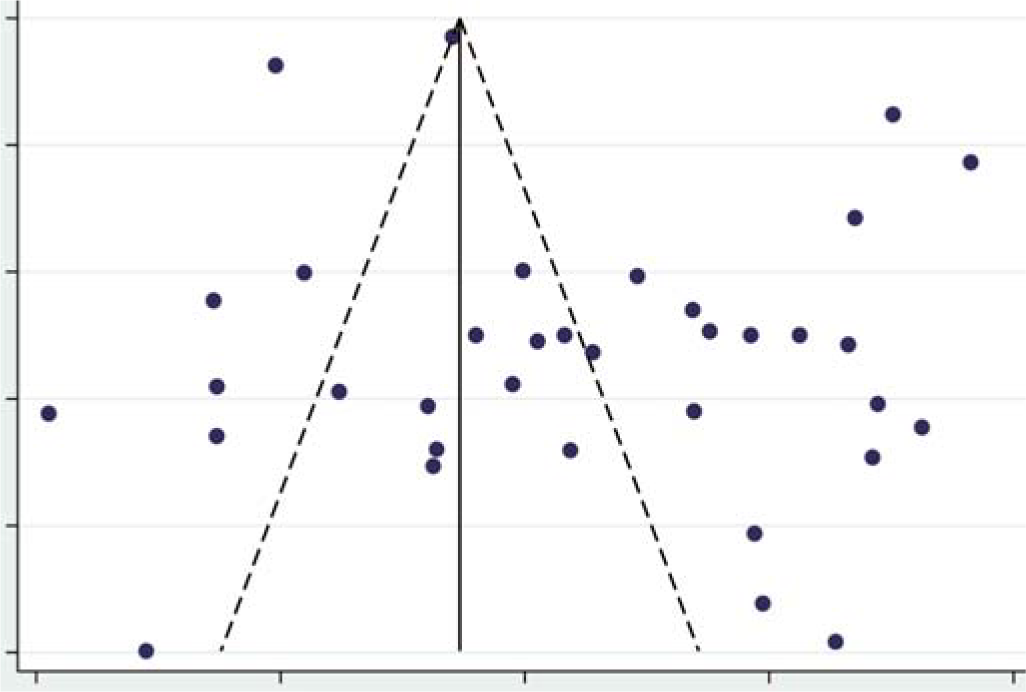
- Funnel plot for assessing publication bias
Sensitivity analysis
We performed sensitivity analysis by removing two large nationally representative multicentric surveys (NFHS and CNNS). The pooled estimate of the prevalence of anaemia among the remaining 33 studies was 66.8% (95% CI 58.6%–74.6%), compared to 65.7% (95% CI 59.3%–71.9%) of the 35 studies. The prevalence of anaemia showed no significant change.
DISCUSSION
We did a systematic review and meta-analysis of data from 35 community-based studies involving 152 640 participants, and the estimated pooled prevalence of anaemia was 65.7% (95% CI 59.3%–71.9%) among adolescent girls in India.
A systematic review and meta-analysis conducted in 2017 by Akbari et al.,50 among Iranian children and adolescents (<18 years), estimated the prevalence of anaemia to be 13.9% (95% CI 10.8%–17.1%); among men and women these were 7.9% (95% CI 4.1%–11.7%) and 8.5% (95% CI 6.1%–10.8%), respectively. Their findings are much lower than our study’s pooled estimate. The reason for the low prevalence of anaemia in their study might be the difference in race and ethnicity.51 Anaemia is multifactorial in origin, diet being an important variable. The reason(s) for the observed difference is not clear and needs further investigation.
There could be various sources for the heterogeneity observed among the studies. Hence, to explore the heterogeneity, we conducted subgroup analysis based on the method used for haemoglobin estimation, geographical region, year of publication, and study setting.
In this review, cyanmethaemoglobin (14/35) and Sahli method (11/35) were the two most commonly used methods to estimate the haemoglobin concentration. Subgroup analysis based on the methods used to estimate the haemoglobin concentration revealed no decrease in heterogeneity, and no significant difference in heterogeneity across the subgroups. The validity of the methods used for measurement of haemoglobin has been tested in various conditions. Studies conducted among school children and adults to estimate the sensitivity and specificity of Sahli method to detect anaemia (capillary and venous blood) was 83%–92% and 39%–63%, respectively.52,53 The sensitivity and specificity of the Hemocue method to detect anaemia (capillary and venous blood) was 82%–93% and 63%–94%, respectively.54–56 Few studies included in this review had used the HCS to assess the concentration of haemoglobin. The sensitivity and specificity of HCS has been reported to be 50%– 88% and 49%–84%, respectively.53,57,58 Though the sensitivity and specificity of tools used to measure haemoglobin concentration vary, they did not contribute to the heterogeneity observed between the subgroups. Digital haemoglobinometers (e.g. HemoCue®) have emerged as a new point-of-care diagnostic tool with acceptable sensitivity and specificity. For a community- based survey for the prevalence of anaemia, it is an easy, simple and portable instrument.
There was no significant decrease in heterogeneity based on geographical region. Based on the study setting, subgroup analysis revealed a modest decrease in heterogeneity among the studies conducted in the tribal area. The prevalence of anaemia among the tribal population was higher than India’s rural and urban areas (87.5%, 62.7% and 61.6%). India has the second-largest tribal population in the world, representing 8.6% of India’s population.59 Apart from other causes of anaemia, the tribal population in India has the additional burden of haemoglobinopathies, e.g. sickle cell anaemia. Hence, it is important from the public health perspective to study the underlying determinants of anaemia in this population.
The prevalence of anaemia estimated from the studies published between 2011 and 2020 is a little higher than that of studies published earlier (68.0% and 60.3%). Despite launching appropriate interventional programmes such as the Weekly Iron and Folic Acid Supplementation (WIFS) and National Iron Plus Initiative (NIPI), the prevalence of anaemia has not declined. The Comprehensive National Nutritional Survey (CNNS) (2016– 2018) estimated that among adolescents (10–19 years), only 12% of those who had anaemia had iron deficiency.18 Another meta-analysis from the national surveys of various countries estimated that only 37% of anaemia was associated with iron deficiency among non-pregnant women of reproductive age group.60 Hence, it appears that only supplementing iron and folic acid will not reduce the burden of anaemia. More research is needed to estimate the proportion of anaemia caused by each determinant apart from iron deficiency. We also did a sensitivity analysis to see whether the inclusion of two large nationally representative studies affected our study’s estimate. There was no difference in the summary estimate after the removal of these two studies.
We systematically searched various electronic databases to identify community-based studies that had estimated the prevalence of anaemia among adolescent girls in India. In total, we identified 35 studies, which allowed us to pool results from 152 640 participants. We used a standard search strategy, risk of bias assessment for individual studies, explored heterogeneity using subgroup analysis and performed sensitivity analysis. The findings of this systematic review and meta-analysis should be interpreted with the following limitations. Even though we followed a comprehensive search strategy, we might have missed some studies in the grey literature, which could have affected the pooled estimate. The estimated pooled prevalence from this study should be interpreted with caution as there was high heterogeneity among the studies.
Conclusion
Our findings suggest a high prevalence of anaemia among adolescent girls in India. Studies are needed to establish the causative factors so that appropriate public health strategies to control anaemia could be developed.
References
- Report of a Joint World Health Organization/Centers for Disease Control and Prevention Technical Consultation on the Assessment of Iron Status at the Population Level, Geneva, Switzerland, 6-8 April 2004. World Health Organization 2007 Available at https://apps.who.int/iris/handle/10665/75368 (accessed on 20 Jul 2021)
- [Google Scholar]
- Iron deficiency: Global prevalence and consequences. Food Nutr Bull. 2003;24(4 Suppl):S99-S103.
- [CrossRef] [PubMed] [Google Scholar]
- Issues in prevention of iron deficiency anaemia in India. Nutrition. 2014;30:764-70.
- [CrossRef] [PubMed] [Google Scholar]
- Adolescent and young adult health. Available at www.who.int/news-room/fact-sheets/detail/adolescents-health-risks-and-solutions (accessed on 11 Jul 2021)
- [Google Scholar]
- Anaemia. Available at www.who.int/westernpacific/health-topics/anaemia (accessed on 20 Jul 2021)
- [Google Scholar]
- Iron deficiency anaemia is still a major killer of pregnant women. Pak J Med Sci. 2016;32:630-4.
- [CrossRef] [PubMed] [Google Scholar]
- Adolescent pregnancy. Available at www.who.int/news-room/fact-sheets/detail/adolescent-pregnancy (accessed on 2 Jul 2021)
- [Google Scholar]
- Adolescent nutrition. Available at www.unicef.org/india/what-we-do/adolescent-nutrition (accessed on 11 Jul 2021)
- [Google Scholar]
- Malnutrition in Children, UNICEF DATA. Available at https://data.unicef.org/topic/nutrition/malnutrition/ (accessed on 11 Jul 2021)
- [Google Scholar]
- Prevalence of anaemia and its associated risk factors among adolescent girls of central Kerala. J Clin Diagn Res. 2016;10:LC19-LC23.
- [CrossRef] [PubMed] [Google Scholar]
- Hemoglobin status of non-school going adolescent girls in three districts of Orissa, India. Int J Adolesc Med Health. 2007;19:395-406.
- [CrossRef] [Google Scholar]
- Preferred reporting items for systematic review and meta-analysis protocols (PRISMA-P) 2015 statement. Systematic Reviews. 2015;4:1.
- [CrossRef] [PubMed] [Google Scholar]
- Meta-analysis of observational studies in epidemiology: A proposal for reporting. Meta-analysis of Observational Studies in Epidemiology (MOOSE) group. JAMA. 2000;283:2008-12.
- [CrossRef] [PubMed] [Google Scholar]
- Critical Appraisal Skills Programme. Available at www.casp-uk.net (accessed on 12 Jul 2021)
- [Google Scholar]
- Prevalence of anaemia among pregnant women and adolescent girls in 16 districts of India. Food Nutr Bull. 2006;27:311-15.
- [CrossRef] [PubMed] [Google Scholar]
- National Family Health Survey. Available at http://rchiips.org/nfhs/factsheet_nfhs-4.shtml (accessed on 18 Feb 2021)
- [Google Scholar]
- Comprehensive National Nutrition Survey (2016-18) reports National Health Mission. Available at www.nhm.gov.in/index1.php?lang=1&level=2&sublinkid=1332&lid=713 (accessed on 6 Jul 2021)
- [Google Scholar]
- Effectiveness of weekly supplementation of iron to control anaemia among adolescent girls of Nashik, Maharashtra, India. J Health Popul Nutr. 2008;26:74-8.
- [Google Scholar]
- An assessment of interventional strategies for control of anaemia among adolescent girls in an urban slum of Karad, Dist, Satara, Maharashtra. Al Ameen J Med Sci. 2014;7:195-200.
- [Google Scholar]
- Effectiveness and feasibility of weekly iron and folic acid supplementation to adolescent girls and boys through peer educators at community level in the tribal area of Gujarat. Indian J Community Med. 2016;41:158-61.
- [CrossRef] [PubMed] [Google Scholar]
- Haemoglobin concentrations for the diagnosis of anaemia and assessment of severity. 2011. Geneva: WHO; Available at https://apps.who.int/iris/handle/10665/85839 (accessed on 20 Aug 2021)
- [Google Scholar]
- Prevalence of anaemia among adolescent girls of rural Tamilnadu. Indian Pediatr. 2000;37:532-6.
- [Google Scholar]
- Socio-demographic correlates of anaemia among adolescents in urban slum. Indian J Public Health Res Dev. 2014;5:155-9.
- [CrossRef] [Google Scholar]
- A study of anaemia among adolescent girls in rural area of Belgaum district, Karnataka, south India. Indian J Public Health Res Dev. 2014;5:238-43.
- [CrossRef] [Google Scholar]
- Prevalence of anaemia among adolescent girls in urban area of Central Madhya Pradesh. J Evolution Med Dental Sci. 2015;4:9750-4.
- [CrossRef] [Google Scholar]
- Socio demographic correlates of anaemia among adolescent girls in rural area of district Meerut (U.P.) Indian J Community Med. 2001;26:173-5.
- [Google Scholar]
- Intestinal parasitic infections, anaemia and undernutrition among tribal adolescents of Madhya Pradesh. Indian J Community Med. 2003;28:26-9.
- [Google Scholar]
- Prevalence of anaemia among adolescent girls in the urban slums of Vellore, south India. Trop Doct. 2006;36:167-9.
- [CrossRef] [PubMed] [Google Scholar]
- Epidemiological correlates of nutritional anaemia in adolescent girls of rural Wardha. Indian J Community Med. 2006;31:255-8.
- [Google Scholar]
- Health status of adolescent girls in slums of Lucknow. Indian J Community Med. 2006;31:102-3.
- [Google Scholar]
- A study of anaemia among adolescent females in the urban area of Nagpur. Indian J Community Med. 2008;33:243-5.
- [CrossRef] [PubMed] [Google Scholar]
- Health problems amongst adolescent girls in rural areas of Ratnagiri district of Maharashtra India. J Clin Diagn Res. 2009;3:1784-90.
- [Google Scholar]
- Community-led initiative for control of anaemia among children 6 to 35 months of age and unmarried adolescent girls in rural Wardha, India. Food Nutr Bull. 2011;32:315-23.
- [CrossRef] [PubMed] [Google Scholar]
- Nutritional status of adolescent girls in rural area of Kolar district-a cross-sectional study. Al Ameen J Med Sci. 2011;4:243-6.
- [Google Scholar]
- Prevalence of anaemia among adolescent girls in an urban slum. National J Community Med. 2012;3:108-11.
- [Google Scholar]
- Anaemia among adolescent girls in tribal area of Visakhapatnam district in Andhra Pradesh. Indian J Public Health Res Develop. 2013;4:12-16.
- [CrossRef] [Google Scholar]
- Prevalence of anaemia among adolescent girls in a rural area of Odisha and its epidemiological correlates. Indian J Maternal Child Health. 2013;15:2-11.
- [Google Scholar]
- A study of prevalence and determinants of anaemia among adolescent girls of urban slums in Bellary city. Int J Health Sci Res. 2014;4:17-25.
- [Google Scholar]
- A community study on prevalence and knowledge regarding anaemia among adolescent girls in a rural area of Rajahmundry, Andhra Pradesh. Indian J Public Health Res Develop. 2015;6:260-6.
- [CrossRef] [Google Scholar]
- Prevalence of anaemia and its association with various risk factors in slum dwelling adolescent girls of Raipur city. Int J Med Res Rev. 2015;3:1064-9.
- [CrossRef] [Google Scholar]
- Prevalence of iron-deficiency anaemia and risk factors in 1010 adolescent girls from rural Maharashtra, India: A cross-sectional survey. Public Health. 2017;142:159-66.
- [CrossRef] [PubMed] [Google Scholar]
- A study showing correlation between anaemia and common parasitological diseases among adolescent girls in villages of PHC Belkhera, Madhya Pradesh, India. Int J Community Med Public Health. 2017;3:373-9.
- [CrossRef] [Google Scholar]
- Nutritional anaemia in adolescent girls: An epidemiological study. Int J Community Med Public Health. 2017;3:808-12.
- [CrossRef] [Google Scholar]
- Prevalence of anaemia among adolescent girls in an urban slum of Kanpur, Uttar Pradesh. Int J Med Sci Public Health. 2017;6:1378-81.
- [CrossRef] [Google Scholar]
- Study of prevalence of iron deficiency anaemia in adolescent girls in Jaipur district, India. Int J Res Ayurveda Pharm. 2018;9:181-5.
- [CrossRef] [Google Scholar]
- Nutritional status of adolescent girls in tribal blocks of Maharashtra. Indian J Community Med. 2019;44:281-4.
- [CrossRef] [PubMed] [Google Scholar]
- Prevalence of anaemia and its associated factors among adolescent girls: A community-based study. Int J Community Med Public Health. 2019;6:3559-64.
- [CrossRef] [Google Scholar]
- Prevalence of anaemia in adolescent girls and its association with certain demographic variables: Our experience from rural Telangana. Int J Community Med Public Health. 2020;7:1007-11.
- [CrossRef] [Google Scholar]
- Estimation of iron deficiency anaemia in Iranian children and adolescents: A systematic review and meta-analysis. Hematology. 2017;22:231-9.
- [CrossRef] [PubMed] [Google Scholar]
- Racial/ethnic differences in patients with anaemia and folate deficiency. Int J Lab Hematol. 2020;42:403-10.
- [CrossRef] [PubMed] [Google Scholar]
- Variability and accuracy of Sahli's method in estimation of haemoglobin concentration. Natl J Integrated Res Med. 2013;4:38-44.
- [Google Scholar]
- Performance of Sahli and colour scale methods in diagnosing anaemia among school children in low prevalence areas. Trop Med Int Health. 2003;8:615-18.
- [CrossRef] [PubMed] [Google Scholar]
- Comparison of performance of digital hemoglobinometer over automated hematology analyzer for hemoglobin estimation, and its user-friendliness among the pregnant women in selected district hospitals of Madhya Pradesh. Indian J Community Med. 2019;44:31-4.
- [CrossRef] [PubMed] [Google Scholar]
- Estimating the prevalence of anaemia: A comparison of three methods. Bull World Health Organ. 2001;79:506-11.
- [Google Scholar]
- Validation of point of care hemoglobin estimation among pregnant women using digital hemoglobinometers (HemoCue 301 and HemoCue 201+) as compared with auto-analyzer. Indian J Hematol Blood Transfus. 2020;36:342-8.
- [CrossRef] [PubMed] [Google Scholar]
- Assessing diagnostic accuracy of haemoglobin colour scale in real-life setting. J Health Popul Nutr. 2014;32:51-7.
- [Google Scholar]
- Validation of the WHO Hemoglobin color scale method. Anaemia. 2014;2014:e531670.
- [CrossRef] [PubMed] [Google Scholar]
- Ministry of Tribal Affairs. Government of India. Available at https://tribal.nic.in/ (accessed on 20 Aug 2021)
- [Google Scholar]
- The proportion of anaemia associated with iron deficiency in low, medium, and high human development index countries: A systematic analysis of national surveys. Nutrients. 2016;8:683-93.
- [CrossRef] [PubMed] [Google Scholar]