Translate this page into:
Prevalence of dyslipidaemia and factors associated with dyslipidaemia among South Asian adults: The Center for Cardiometabolic Risk Reduction in South Asia Cohort Study
2 Public Health Foundation of India (PHFI), Gurugram, Haryana, India and Centre for Chronic Disease Control, New Delhi, India
3 Centre for Chronic Disease Control, New Delhi, India
4 Madras Diabetes Research Foundation (MDRF) and Dr Mohan’s Diabetes Specialities Centre, Chennai, India
5 Public Health Foundation of India (PHFI), Gurugram, Haryana, India
6 Hubert, Department of Global Health, Emory University Rollins School of Public Health, Atlanta, Georgia, USA
7 Department of Endocrinology and Metabolism, All India Institute of Medical Sciences, Ansari Nagar, New Delhi 110029, India
Corresponding Author:
Nikhil Tandon
Department of Endocrinology and Metabolism, All India Institute of Medical Sciences, Ansari Nagar, New Delhi 110029
India
nikhil_tandon@hotmail.com
| How to cite this article: Fatmi Z, Kondal D, Shivashankar R, Iqbal R, Khan AA, Mohan D, Pradeepa R, Gupta R, Ali MK, Ajay VS, Mohan V, Kadir MM, Narayan K M, Prabhakaran D, Tandon N. Prevalence of dyslipidaemia and factors associated with dyslipidaemia among South Asian adults: The Center for Cardiometabolic Risk Reduction in South Asia Cohort Study. Natl Med J India 2020;33:137-145 |
Abstract
Background. The pattern of dyslipidaemia in South Asia is believed to be different from that in other parts of the world. Nonetheless, limited population-based data are available from the region. We assessed the prevalence, types of, and factors associated with dyslipidaemia among South Asians.Methods. We used baseline data (2010–11) of the Center for Cardiometabolic Risk Reduction in South Asia (CARRS) cohort of 16 287 representative urban adults aged ≥20 years from Chennai and Delhi in India and Karachi in Pakistan. Total cholesterol (TC) was measured by the enzymatic-cholesterol oxidase peroxidase method, high-density lipoprotein-cholesterol (HDL-C) by the direct homogeneous method and triglycerides (TG) by enzymatic methods. Low-density lipoprotein-cholesterol (LDL-C) was calculated using Friedewald’s formula. We defined high TC ≥200 mg/dl or on medication; hypertriglyceridaemia ≥150 mg/dl, high LDL-C ≥130 mg/dl or on medication and low HDL-C <40 mg/dl for males, <50 mg/dl for females. Multivariate logistic regression was carried out to assess the factors associated with dyslipidaemia.
Results. The prevalence of any dyslipidaemia was 76.4%, 64.3% and 68.5% among males and 89.3%, 74.4% and 79.4% among females in Chennai, Delhi and Karachi, respectively. The prevalence of elevated TC was higher in Chennai compared to Delhi and Karachi (31.3%, 28.8% and 22.9%, respectively); males had a significantly greater prevalence of high TG, whereas females had a greater prevalence of low HDL-C in all the three cities. The most common lipid abnormality in all three cities was low HDL-C, which was seen in 67.1%, 49.7% and 61.3% in Chennai, Delhi and Karachi, respectively. Only 2% of the participants were on lipid-lowering drugs. Adjusted for other factors, dyslipidaemia was positively associated with age, female sex, obesity, hypertension, diabetes and tobacco use.
Discussion. Overall, almost seven in ten adults in urban South Asia have some form of dyslipidaemia, and the predominant subtypes were low HDL-C and high TG.
Introduction
Coronary heart disease (CHD) is the most important cause of mortality and the major cause of morbidity worldwide.[1] Most (60%) of the burden of CHD is in low- and middle-income countries.[1],[2] Between 1990 and 2016, CHD increased by 81% to become the leading cause of death in low- and middle-income countries, while during the same period, it decreased by 43% in high-income countries.[3] Concurrently, the prevalence of CHD was also reported to be higher in South Asians compared to other ethnic groups in several studies.[3],[4],[5],[6]
Dyslipidaemia or abnormal levels of serum lipids constitute one of the important independent modifiable risk factors[7] and are estimated to account for 56% of CHD.[8],[9] Several studies have found a strong association between dyslipidaemia and CHD worldwide[7],[10] including in South Asians.[11],[12],[13]
Limited data are available regarding the prevalence of dyslipidaemia among South Asians. With economic growth and lifestyle changes in South Asia, the prevalence of dyslipidaemia is expected to increase and will have a major impact on CHD-related deaths among this population. Furthermore, there is a need to classify the most important types of dyslipidaemia as this may influence what treatments can successfully lower CHD events and mortality in the region. We, therefore, conducted a population-based survey to determine the frequency and pattern of dyslipidaemia and its associated factors in three metropolitan cities of South Asia. We report the lipid profiles in Chennai (India), Delhi (India) and Karachi (Pakistan); determine the types of dyslipidaemia across subpopulations (city, age and sex) and also assess the factors associated with dyslipidaemia.
Methods
We analysed cross-sectional survey data collected in 2011 from the baseline of the Center for Cardiometabolic Risk Reduction in South Asia (CARRS) study cohort. The study setting, sample size calculation, sampling procedure and data collection have been published earlier.[14] The study used multistage cluster random sampling to recruit 16 287 non-pregnant adult females and males aged ≥20 years who were representative of Chennai (India), Delhi (India) and Karachi (Pakistan). All participants (or their next of kin or caregivers) provided written informed consent prior to enrolment. Data were collected through household interviews in local languages and standardized measurements of anthropometry and blood pressure. Blood samples (15 ml) were collected in fasting state in the morning. For the three cities together, response rates were 94.7% for questionnaire completion and 84.3% for bio-specimens.
Specimen handling and laboratory analysis
The blood samples were transported from field sites in cold chain to the laboratories for analysis. All the three accredited laboratories in respective cities participated in a Randox International Quality Assessment Scheme. Blood samples were analysed on the same day they were collected.
Total cholesterol (TC) was measured by the enzymatic-cholesterol oxidase peroxidase method, high-density lipoprotein-cholesterol (HDL-C) by the direct homogeneous method and triglycerides (TG) by enzymatic methods (Roche-Diagnostics, Switzerland). Low-density lipoprotein-cholesterol (LDL-C) was calculated using the Friedewald formula.
Plasma glucose was measured by the hexokinase/kinetic method in Chennai and Delhi and by the glucose oxidase/end-point method in Karachi. The glycated haemoglobin (HbA1c) was measured by the high-performance liquid chromatography method.
Study measures and definitions
Dyslipidaemia was defined according to the ATPIII guidelines:[15] high cholesterol if TC ≥200 mg/dl (5.17 mmol/L) or on lipid-lowering medicine; hypertriglyceridaemia if TG ≥150 mg/dl (1.69 mmol/L); high LDL cholesterol if LDL-C ≥130 mg/dl (3.36 mmol/L) or on lipid-lowering medicine and low HDL-C if HDL-C <40 mg/dl (1.03 mmol/L) among males or <50 mg/dl (1.29 mmol/L) among females. ‘Any type of dyslipidaemia’ was defined if one or more abnormal serum lipids were present. We also calculated non-HDL-C by subtracting HDL-C from TC. High non-HDL-C was defined as ≥150 mg/dl (1.69 mmol/L).
Based on participant responses, education was categorized as no formal education, high/secondary schooling and college graduate and above. To characterize household wealth, principal component analysis was used and the total scores were categorized in tertiles of socioeconomic status (lowest tertile representing the poorest and highest tertile representing the wealthiest).[16] Occupation was categorized into those not working, unskilled, skilled, trained and professional. Intake of fruits (all fruits and fruit juices) and vegetables (leafy green, raw and cooked vegetables) from the Food Frequency Questionnaire was categorized into <2 servings/day, 2–4 servings/day and >4 servings/day. Body mass index (BMI) was reported as: <23, 23–25 and ≥25 kg/m2. Hypertension was defined as on medication or an average of two blood pressure (BP) readings where systolic BP ≥140 mmHg and/or a diastolic BP ≥90 mmHg. Pre-hypertension was defined as systolic BP between 120 and 140 mmHg and/or diastolic BP between 80 and 90 mmHg using the JNC-7 criteria.[17] Diabetes was categorized as no diabetes, pre-diabetes, newly diagnosed diabetes and known diabetes. Known diabetes was defined as individuals with a self-reported history of diabetes. Newly diagnosed diabetes was defined as fasting plasma glucose (FPG) ≥126 mg/dl and/or HbA1c ≥6.5% and no prior diagnosis of diabetes. Pre-diabetes was defined as FPG 100–125 mg/dl (impaired fasting glucose or HbA1c 5.7%–6.4%) and no prior diagnosis of diabetes. Current tobacco use and alcohol consumption were categorized as Yes/No based on participant responses.
Statistical analysis
The analysis was done on Stata software (version 14.2 SE, StataCorp, TX, USA) with appropriate sampling weights. We used multiple imputations to account for missing outcomes. The number of missing values in the CARRS dataset has been published previously.[16] In short, missing values in the questionnaires, blood pressure, BMI, blood biochemistry and overall were 0%, 4.9%, 23%, 15.8% and 25%, respectively. Imputation methods are described in greater detail elsewhere.[16] All the estimates are reported for the multiple imputed dataset unless otherwise specified.
Continuous variables were displayed as mean and 95% confidence interval (CI) and percentages (95% CI) for categorical variables. Characteristics of the population were summarized overall and for males and females separately stratified by the city. We reported mean levels of lipids and prevalence of dyslipidaemia standardized to world population overall, stratified by sex and city using the WHO’s world standard population.[18] We used the SVY technique for all analyses to account for the complex survey design, including survey strata and sampling weights.
Associations between risk factors and dyslipidaemia were assessed using multivariate logistic regression analysis with abnormal serum levels of high TC, high TG, high LDL-C, low HDL-C and any type of dyslipidaemia as dependent variables. Age (centred to mean), sex, education, occupation, wealth index, consumption of fruits and vegetables, BMI, presence of hypertension and diabetes and tobacco and alcohol use were considered independent variables. To assess the relationship of age with abnormal serum levels of high TC, high TG, high LDL-C, low HDL-C and any type of dyslipidaemia, the scatter plot was plotted between proportions with abnormal serum levels with age. In addition, we did a sensitivity analysis by excluding participants on treatment for dyslipidaemia in the regression model.
A sensitivity analysis for estimates (means and prevalences) between the complete case dataset and multiple imputed datasets was also performed. We also reported estimates that were age–sex standardized to the regional population.[18]
The study was approved by the ethics committees of the Madras Diabetes Research Foundation (Chennai), Public Health Foundation of India and All India Institute of Medical Sciences (AIIMS, Delhi), Aga Khan University (Karachi) and Emory University (Atlanta). Written informed consent was obtained from all participants.
Results
General characteristics of the study population
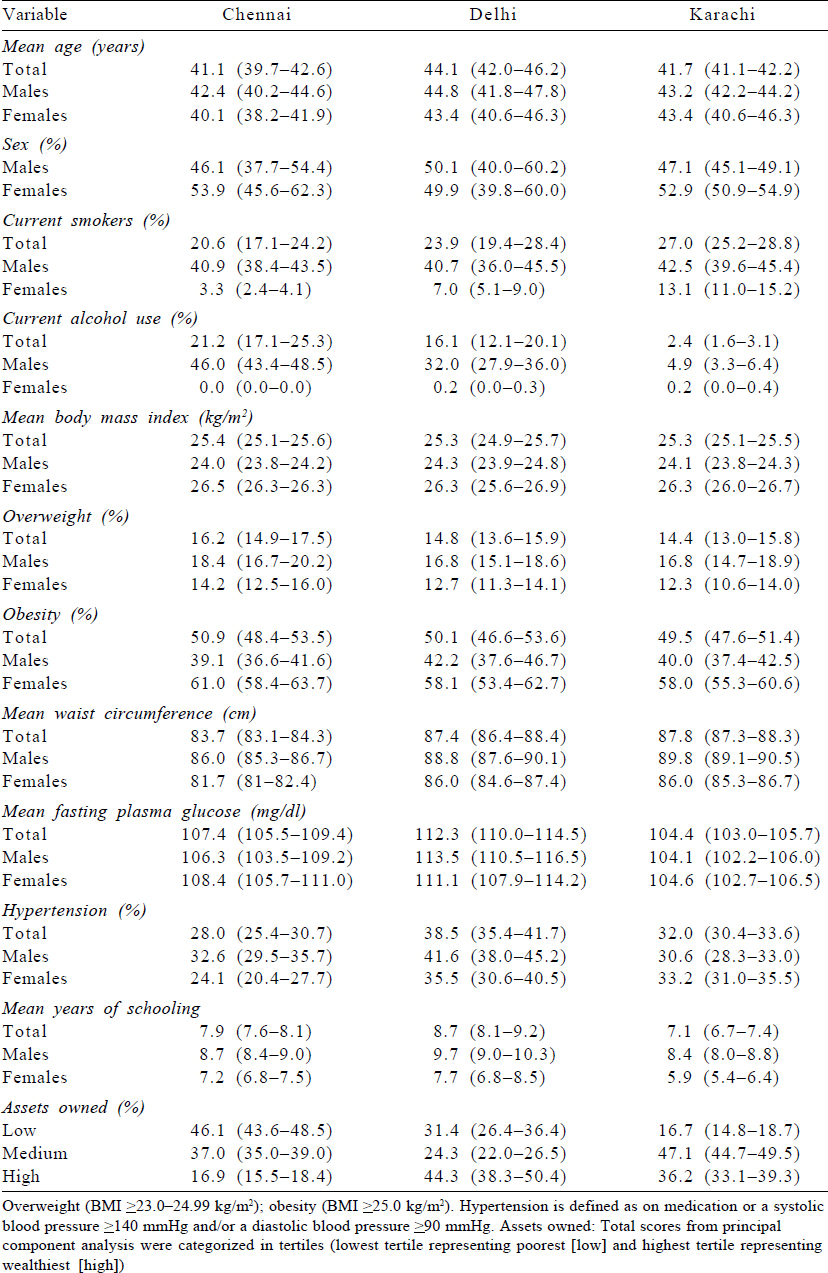
Of the 16 287 participants, 42.4% (6906) were recruited from Chennai, 32.9% (5364) from Delhi and 24.7% (4017) from Karachi. The mean (95% CI) age of the participants was 42.2 (41.1, 43.4) years and 53.3% were females [Table - 1]. Overall, compared to males, females were slightly younger (41.2 v. 43.4 years), were less likely to report smoking (6.9% v. 41.2%), report alcohol use (0.1% v. 31%), had higher BMIs (26.4 v. 24.1 kg/m2) and lower waist circumference (84.1 v. 87.9 cm). About 61% of the participants had high/secondary school education followed by primary education (22%) and graduation and above (16%), and there was no difference between male and female respondents. Female participants also had lower BP (systolic BP 119.2 v. 126.4 mmHg; diastolic BP 79.7 v. 82.9 mmHg) and similar FPG (108.3 v. 108.3 mg/dl) compared to males. Only a small proportion of participants were on lipid-lowering drugs (2.4%).
Prevalence of dyslipidaemia
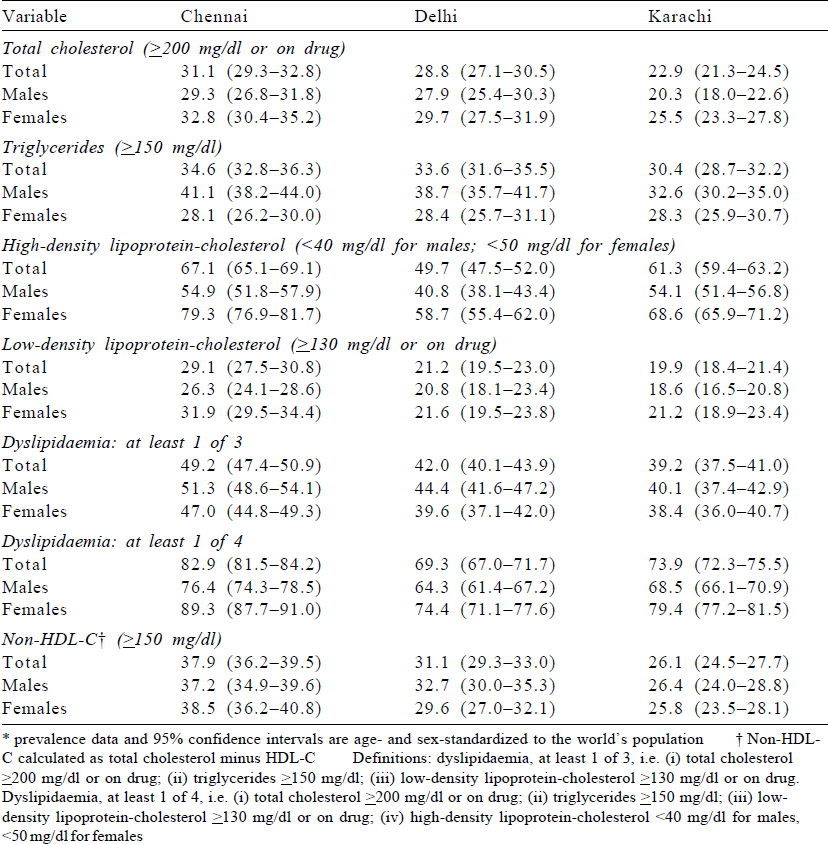
The overall age-standardized prevalence of high TC was 31.3%, 28.8% and 22.9% in Chennai, Delhi and Karachi, respectively [Table - 2]. The prevalence of high TG was more among males compared to females in the three cities. The most common lipid abnormality in the three cities was low HDL-C, which was seen in 67.1%, 49.7% and 61.3% in Chennai, Delhi and Karachi, respectively. The prevalence of high LDL-C was higher in Chennai compared to Delhi and Karachi (29.1% in Chennai, 21.2% in Delhi and 19.9% in Karachi). At least one abnormal lipid level out of four (based on TC ≥200 mg/dl or on treatment; TG ≨150 mg/dl; LDL ≥130 mg/dl or on treatment; low HDL-C (<40 mg/dl for males, <50 mg/dl for females) was recorded in 76.4%, 64.3% and 68.5% among males and 89.3%, 74.4% and 79.4% among females in Chennai, Delhi and Karachi, respectively. The prevalence of dyslipidaemia using the complete case dataset (n=13 707) and age–sex standardized to regional population is provided in [Supplementary Table S1] (available at www.nmji.in).
The prevalence of high TC, high TG and high LDL-C was higher with age categories among both females and males in Chennai, Delhi and Karachi ([Figure - 1], [Appendix 1 [SUPPORTING:1]] [available at www.nmji.in]). The distribution of low HDL-C with age is curvilinear, initially showing a slight increase with increasing age from 20 to 24 years onwards, but declining after 45 years of age. Males had a significantly greater prevalence of high TG, whereas females had a greater prevalence of low HDL-C.
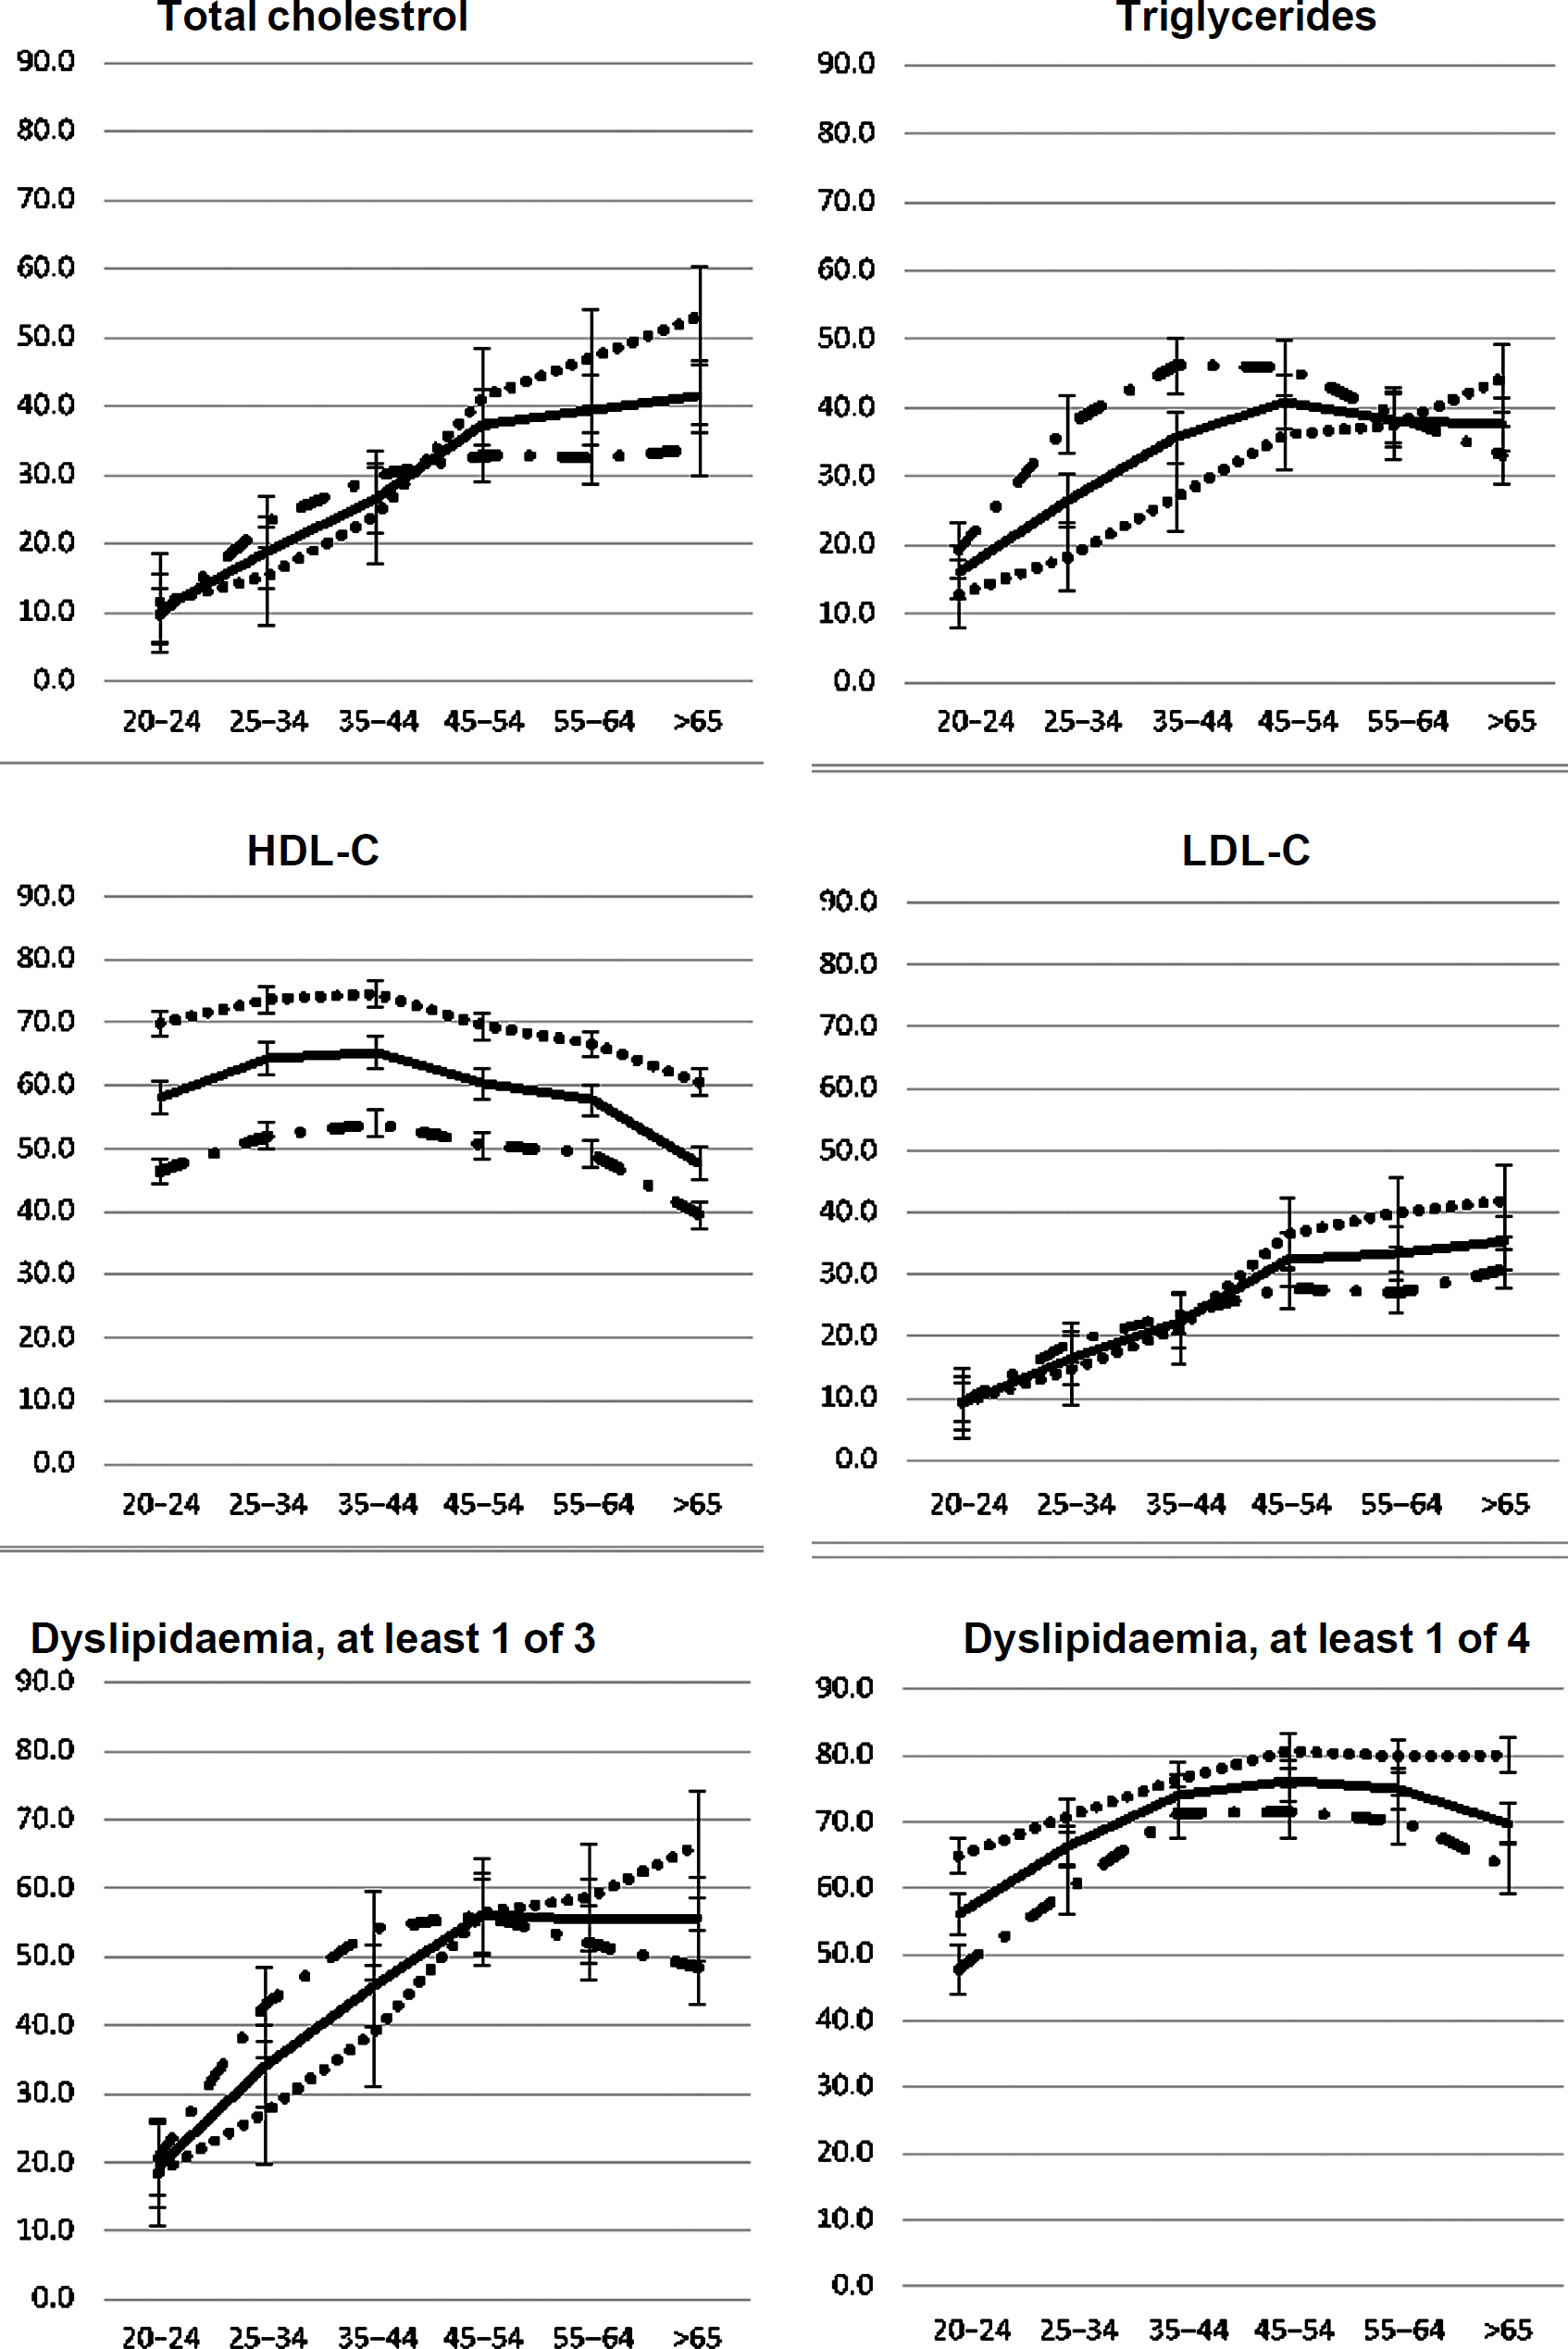 |
| Figure 1: Age–sex specific prevalence of dyslipidaemia–total |
Mean lipid levels
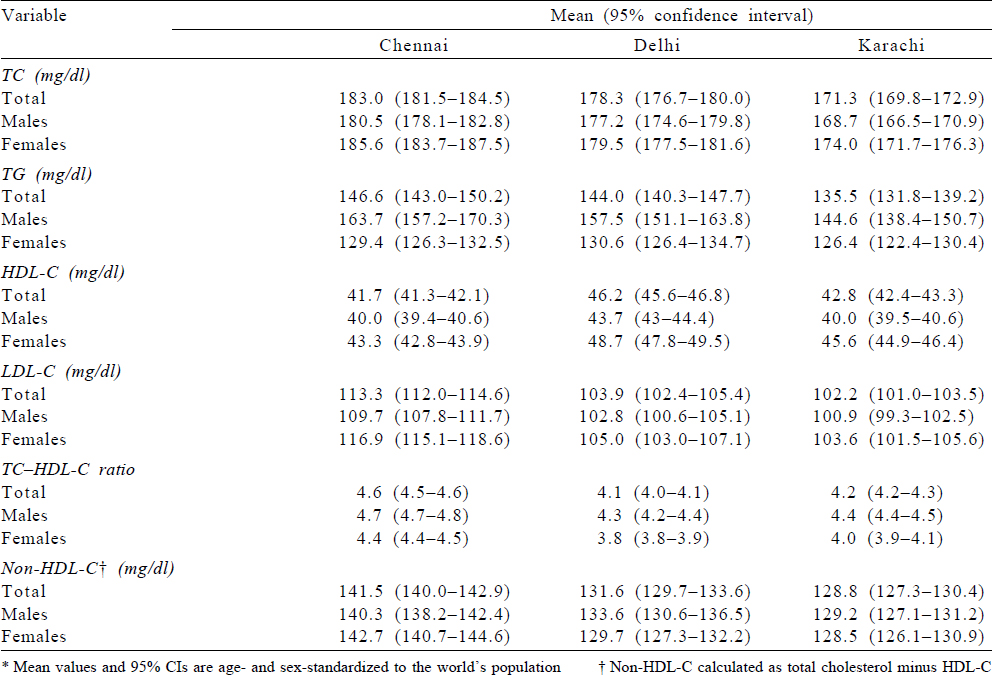
Mean levels (mg/dl) for lipid parameters excluding participants on lipid-lowering drugs for Chennai, Delhi and Karachi were as follows: TC (mg/dl) 183.0, 178.3 and 171.3; TG (mg/dl) 146.6, 144.0 and 135.5; HDL-C (mg/dl) 41.7, 46.2 and 42.8 and LDL-C (mg/dl) 113.3, 103.9 and 102.2, respectively [Table - 3]. Males had lower values for mean TC (mg/dl) in Chennai, Delhi and Karachi compared to females, while mean TG (mg/dl) was lower among females compared to males in the three cities. [Supplementary Table S2] shows the age–sex standardized mean level of total serum lipids for all participants and shows that the mean values are slightly lower compared to those on treatment. The mean values excluding participants on treatment using the complete case dataset (n=13 362) and standardized to regional population is also provided in [Supplementary Table S3]. The mean values are almost similar to the values reported in [Table - 3].
Factors associated with dyslipidaemia
Overall, the relation of age with high TC, high TG, high LDL-C, low HDL-C and at least one abnormal lipid level was fairly linear with some curvatures at older ages [Table - 4].
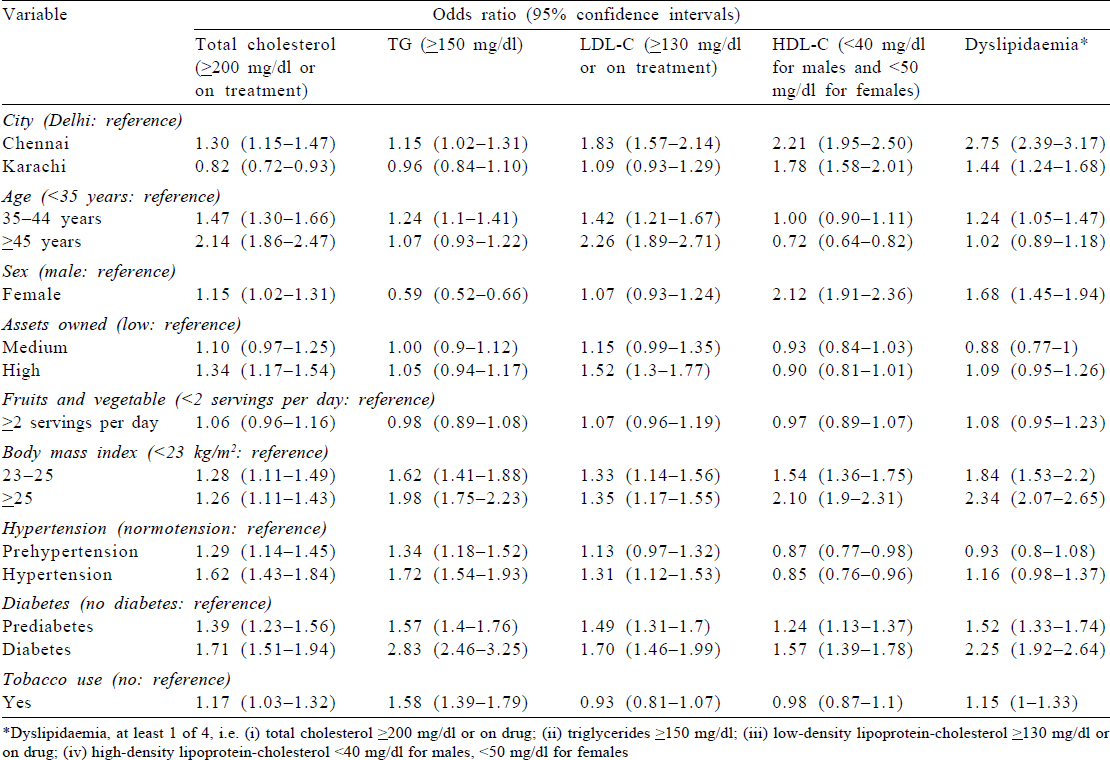
In regression analysis, we noted that higher age (≥) (odds ratio [OR] 2.14); female sex (OR 1.15); residence in Chennai (OR 1.30); high assets owned (OR 1.34); higher BMI; participants with prehypertension and hypertension; participants with prediabetes and diabetes and tobacco use (OR 1.17) were all associated with higher TC.
High TG was less common among females compared to males (OR 0.59). In addition, residents of Karachi had lower TG compared to those of Delhi (OR 0.96).
For high LDL-C, we found that higher age, residence in Chennai, affluent population (high assets owned), higher BMI, hypertension and diabetes (known, newly diagnosed and prediabetes) were all associated with high LDL-C.
Low HDL-C was high in Chennai (OR 2.21) and Karachi (OR 1.78) compared to the population of Delhi. Female sex (OR 2.12), higher BMI, participants with diabetes and prediabetes were all significantly associated with low HDL-C.
Chennai (OR 2.75) and Karachi (1.47) residents were more likely to have at least one abnormal lipid level among all the lipids compared to those of Delhi. We found that other factors associated with dyslipidaemia (at least one abnormal lipid level among all the lipids) were higher age, female sex, higher BMI and participants with known diabetes, newly diagnosed diabetes and prediabetes.
The associations between exposures and high TC, high TG, high LDL-C, low HDL-C or at least one abnormal lipid level stratified by males and females are shown in [Supplementary Tables S4] and [Supplementary Tables S5].
Discussion
Main findings
Our study represents a large urban South Asian population which showed a disturbingly high prevalence of dyslipidaemia. Seven of ten adults in these mega cities had at least one abnormal lipid value. The prevalence of dyslipidaemia was higher among females than males. The proportion of participants on lipid-lowering drugs is extremely low. The most striking and major type of dyslipidaemia among the study population was low HDL-C and high TG. Low HDL-C was more common among females, whereas high TG was more frequent among males. Higher age, female sex, higher BMI, hypertension, diabetes mellitus and tobacco use were associated with higher likelihood of having dyslipidaemia.
Comparison with previous research
Our study findings on the high prevalence of dyslipidaemia are consistent with previously reported data from India and Pakistan.[19],[20],[21] A study among adult Arabs in Saudi Arabia found a similar dyslipidaemia profile.[22] A 2013 update of heart disease and stroke statistics among Americans[23] reported similar distribution of lipid abnormalities as found in our study but lower prevalence of elevated TG and low HDL. On the contrary, a study from urban Shanghai area, China, had shown strangely low prevalence of low HDL-C (1.0%).[24]
Few previous studies have reported the prevalence of dyslipidaemia among South Asian immigrants and have compared it with the local western population. Most of these studies were of small sample and have reported that mean lipid levels were higher among South Asian immigrants compared to their Caucasian counterparts.[25],[26],[27] However, one study (MASALA) has also found comparable levels for HDL-C between South Asian and other immigrants.[28]
Our findings from the study showing a predominance of the high TG and low HDL combination reconfirm the presence of a unique lipidotype of South Asians. This is part of a phenotype, popularly known as South Asian dyslipidaemia consisting of high serum levels of apolipoprotein B, lipoprotein (a) and TG and low levels of apolipoprotein A1 and HDL-C.[29]
Several factors have been speculated to contribute to this unique presentation. First, South Asians have a higher concentration of plasma leptin and non-esterified fatty acids and lower adiponectin compared to Caucasian population.[30],[31] Second, rapid economic development and urbanization in the past two decades have resulted in the consumption of diets high in saturated fats, cholesterol and refined carbohydrates and low in polyunsaturated fatty acids and fibre.[32] Third, mechanization of industry, household work and transport has resulted in considerably lower physical activity in South Asians.[33] Unhealthy diets and sedentary lifestyle superimposed on genetically predisposed South Asians may have resulted in a high burden and unique forms of dyslipidaemia.[34]
We used guidelines wherein fairly low thresholds of LDL are considered dyslipidaemic, and this may explain the low use of lipid-lowering medicines. This may also be due to less awareness about dyslipidaemia, treatment and control. Previous studies conducted in South Asia (India, Pakistan and Bangladesh) have shown suboptimal use of lipid-lowering drugs, especially in those with lower education and wealth indexes.[35],[36],[37] This low use of lipid-lowering drugs such as statins in India may reflect problems with access to healthcare, affordability, under-diagnosis and cultural beliefs.[38]
Strengths and limitations of the study
Our prevalence estimates are based on representative population-based samples from three large cities in South Asia, standardized measurement techniques, uniform study protocols and accounting for the complex study design in the analysis. We also did multiple imputation using chained equation for imputing all missing values across all variables. We used the WHO’s world standard population to report the standardized mean lipid levels stratified by age groups, sex and city, and sensitivity analyses were also done by excluding participants on treatment for dyslipidaemia in the regression model. The response rate for questionnaire was 94.7% and for bio-specimen, it was 84.3%. However, we do not expect systematic differences between responders and non-responders. The participation rate can be considered high and acceptable to draw conclusions about prevalence and associated factors in three cities of South Asia. In addition, generalizability of our findings is limited to adult males and females living in urban locations of South Asia.
The cross-sectional nature of the data limits causal inferences and generalization of the results. However, with follow-up of the CARRS cohort, which is currently in progress, the causal pathways underlying the reported relationships with risk factors could be investigated further.
Importance of the study findings
The public health implications of the results are that there is a growing need to address dyslipidaemia at the population level in South Asia. The unique presentation of high TG and low HDL-C presents a major challenge. Data indicate the potential benefit of treating hyperglyceridaemia over and above statin therapy, and such studies in South Asian populations are needed.[39] In addition, rapid globalization and urbanization is leading to swift changes in cardiometabolic profiles, calling for aggressive population-level interventions to combat dyslipidaemia. Addressing dyslipidaemia means modification in lifestyle focusing on urban lifestyle factors which may help prevent associated risk factors such as diabetes, hypertension, tobacco use and sedentary lifestyle. Awareness about the increasing risk of dyslipidaemia and its associated risk factors for the population needs to be communicated to relevant stakeholders including health policy-makers, healthcare providers and, most importantly, to the communities affected.
Females in South Asia were possibly at a higher risk as a result of several sociocultural factors that preclude engaging in healthier lifestyle habits such as physical activity.[36]
Conclusions
Dyslipidaemia is highly prevalent among the South Asian adult population, more among females than males. Low HDL-C and high TG were the major subtypes of dyslipidaemia. The proportion of participants using lipid-lowering drugs is low. Increasing age, female sex, increased BMI, hypertension, diabetes mellitus and tobacco use were strong risk factors for dyslipidaemia in South Asians.
Acknowledgements
The CARRS study was funded by the National Heart, Lung, and Blood Institute of the National Institutes of Health, Department of Health and Human Services (contract no. HHSN268200900026C) and the United Health Group (Minneapolis, MN, USA). The author Roopa Shivashankar (RS) was supported by a Wellcome Trust Capacity Strengthening Strategic Award Extension phase to the Public Health Foundation of India and a consortium of UK universities (WT084754/ Z/08/A).
Conflicts of interest. None declared
| 1. | Lozano R, Naghavi M, Foreman K, Lim S, Shibuya K, Aboyans V, et al. Global and regional mortality from 235 causes of death for 20 age groups in 1990 and 2010: A systematic analysis for the global burden of disease study 2010. Lancet 2012;380:2095–128. [Google Scholar] |
| 2. | Bowry AD, Lewey J, Dugani SB, Choudhry NK. The burden of cardiovascular disease in low-and middle-income countries: Epidemiology and management. Can J Cardiol 2015;31:1151–9. [Google Scholar] |
| 3. | Institute for Health Metrics and Evaluation. GBD compare data visualization. Seattle, WA:Institute for Health Metrics and Evaluation, University of Washington; 2016. Available at https://vizhub.healthdata.org/gbd-compare/ (accessed on 20 Aug 2008). [Google Scholar] |
| 4. | World Health Organization. Definition and diagnosis of diabetes mellitus and intermediate hyperglycaemia. Geneva:WHO; 2006. [Google Scholar] |
| 5. | Jafar TH, Jafary FH, Jessani S, Chaturvedi N. Heart disease epidemic in Pakistan: Women and men at equal risk. Am Heart J 2005;150:221–6. [Google Scholar] |
| 6. | Ramachandran A, Snehalatha C, Satyavani K, Sivasankari S, Vijay V. Metabolic syndrome in urban Asian Indian adults—A population study using modified ATP III criteria. Diabetes Res Clin Pract 2003;60:199–204. [Google Scholar] |
| 7. | Stamler J, Daviglus ML, Garside DB, Dyer AR, Greenland P, Neaton JD. Relationship of baseline serum cholesterol levels in 3 large cohorts of younger men to long-term coronary, cardiovascular, and all-cause mortality and to longevity. JAMA 2000;284:311–18. [Google Scholar] |
| 8. | World Health Organization. World Health Report 2002: Quantifying Selected Major Risks to Health. Geneva:WHO; 2002. Available at www.who.int/whr/ 2002/en (accessed on 10 Aug 2018). [Google Scholar] |
| 9. | Vergani C, Lucchi T. Plasma HDL cholesterol and risk of myocardial infarction. Lancet 2012;380:1990. [Google Scholar] |
| 10. | Lewington S. The importance of cholesterol, blood pressure and smoking for coronary heart disease. Eur Heart J 2003;24:1703–4. [Google Scholar] |
| 11. | Wierzbicki AS, Nishtar S, Lumb PJ, Lambert-Hammill M, Turner CN, Crook MA, et al. Metabolic syndrome and risk of coronary heart disease in a Pakistani cohort. Heart 2005;91:1003–7. [Google Scholar] |
| 12. | Joshi P, Islam S, Pais P, Reddy S, Dorairaj P, Kazmi K, et al. Risk factors for early myocardial infarction in South Asians compared with individuals in other countries. JAMA 2007;297:286–94. [Google Scholar] |
| 13. | Hughes LO, Wojciechowski AP, Raftery EB. Relationship between plasma cholesterol and coronary artery disease in Asians. Atherosclerosis 1990;83:15–20. [Google Scholar] |
| 14. | Nair M, Ali MK, Ajay VS, Shivashankar R, Mohan V, Pradeepa R, et al. CARRS surveillance study: Design and methods to assess burdens from multiple perspectives. BMC Public Health 2012;12:701. [Google Scholar] |
| 15. | Expert Panel on Detection, Evaluation, and Treatment of High Blood Cholesterol in Adults. Executive summary of the third report of the National Cholesterol Education Program (NCEP) expert panel on detection, evaluation, and treatment of high blood cholesterol in adults (Adult Treatment Panel III). JAMA 2001;285:2486–97. [Google Scholar] |
| 16. | Ali MK, Bhaskarapillai B, Shivashankar R, Mohan D, Fatmi ZA, Pradeepa R, et al. Socioeconomic status and cardiovascular risk in urban South Asia: The CARRS study. Eur J Prev Cardiol 2016;23:408–19. [Google Scholar] |
| 17. | Chobanian AV, Bakris GL, Black HR, Cushman WC, Green LA, Izzo JL Jr, et al. The seventh report of the Joint National Committee on prevention, detection, evaluation, and treatment of high blood pressure: The JNC 7 report. JAMA 2003;289:2560–72. [Google Scholar] |
| 18. | World Bank. Population Projection Tables by Country and Group; 2011. Available at https://datacatalog.worldbank.org/dataset/population-estimates-and-projections. (accessed on 10 Aug 2018). [Google Scholar] |
| 19. | Joshi SR, Anjana RM, Deepa M, Pradeepa R, Bhansali A, Dhandania VK, et al. Prevalence of dyslipidemia in urban and rural India: The ICMR-INDIAB study. PLoS One 2014;9:e96808. [Google Scholar] |
| 20. | Bhardwaj S, Misra A, Misra R, Goel K, Bhatt SP, Rastogi K, et al. High prevalence of abdominal, intra-abdominal and subcutaneous adiposity and clustering of risk factors among Urban Asian Indians in North India. PLoS One 2011;6:e24362. [Google Scholar] |
| 21. | Zahid N, Asghar S, Claussen B, Hussain A. Depression and diabetes in a rural community in Pakistan. Diabetes Res Clin Pract 2008;79:124–7. [Google Scholar] |
| 22. | Al-Daghri NM, Al-Attas OS, Alokail MS, Alkharfy KM, Sabico SL, Chrousos GP. Decreasing prevalence of the full metabolic syndrome but a persistently high prevalence of dyslipidemia among adult Arabs. PLoS One 2010;5:e12159. [Google Scholar] |
| 23. | Go AS, Mozaffarian D, Roger VL, Benjamin EJ, Berry JD, Borden WB, et al. Heart disease and stroke statistics-2013 update: A report from the American Heart Association. Circulation 2013;127:e6–e245. [Google Scholar] |
| 24. | Wu JY, Duan XY, Li L, Dai F, Li YY, Li XJ, et al. Dyslipidemia in Shanghai, China. Prev Med 2010;51:412–15. [Google Scholar] |
| 25. | Chambers JC, Eda S, Bassett P, Karim Y, Thompson SG, Gallimore JR, et al. C-reactive protein, insulin resistance, central obesity, and coronary heart disease risk in Indian Asians from the United Kingdom compared with European whites. Circulation 2001;104:145–50. [Google Scholar] |
| 26. | Kamath SK, Hussain EA, Amin D, Mortillaro E, West B, Peterson CT, et al. Cardiovascular disease risk factors in 2 distinct ethnic groups: Indian and Pakistani compared with American premenopausal women. Am J Clin Nutr 1999;69:621–31. [Google Scholar] |
| 27. | Bhalodkar NC, Blum S, Rana T, Kitchappa R, Bhalodkar AN, Enas EA. Comparison of high-density and low-density lipoprotein cholesterol subclasses and sizes in Asian Indian women with Caucasian women from the Framingham offspring study. Clin Cardiol 2005;28:247–51. [Google Scholar] |
| 28. | Kanaya AM, Herrington D, Vittinghoff E, Ewing SK, Liu K, Blaha MJ, et al. Understanding the high prevalence of diabetes in U.S. South Asians compared with four racial/ethnic groups: The MASALA and MESA studies. Diabetes Care 2014;37:1621–8. [Google Scholar] |
| 29. | Enas EA, Mohan V, Deepa M, Farooq S, Pazhoor S, Chennikkara H. The metabolic syndrome and dyslipidemia among Asian Indians: A population with high rates of diabetes and premature coronary artery disease. J Cardiometab Syndr 2007;2:267–75. [Google Scholar] |
| 30. | Abate N, Chandalia M, Snell PG, Grundy SM. Adipose tissue metabolites and insulin resistance in nondiabetic Asian Indian men. J Clin Endocrinol Metab 2004;89:2750–5. [Google Scholar] |
| 31. | Chu JW, Abbasi F, Kulkarni KR, Lamendola C, McLaughlin TL, Scalisi JN, et al. Multiple lipoprotein abnormalities associated with insulin resistance in healthy volunteers are identified by the vertical auto profile-II methodology. Clin Chem 2003;49:1014–17. [Google Scholar] |
| 32. | Misra A, Shrivastava U. Obesity and dyslipidemia in South Asians. Nutrients 2013;5:2708–33. [Google Scholar] |
| 33. | Anjana RM, Pradeepa R, Das AK, Deepa M, Bhansali A, Joshi SR, et al. Physical activity and inactivity patterns in India––Results from the ICMR-INDIAB study (Phase-1) [ICMR-INDIAB-5]. Int J Behav Nutr Phys Act 2014;11:26. [Google Scholar] |
| 34. | Misra A, Khurana L, Isharwal S, Bhardwaj S. South Asian diets and insulin resistance. Br J Nutr 2009;101:465–73. [Google Scholar] |
| 35. | Khandelwal S, Swamy MK, Patil K, Kondal D, Chaudhry M, Gupta R, et al. The impact of Docosahexaenoic acid supplementation during pregnancy and lactation on neurodevelopment of the offspring in India (DHANI): Trial protocol. BMC Pediatr 2018;18:261. [Google Scholar] |
| 36. | Guptha S, Gupta R, Deedwania P, Bhansali A, Maheshwari A, Gupta A, et al. Cholesterol lipoproteins and prevalence of dyslipidemias in urban Asian Indians: A cross sectional study. Indian Heart J 2014;66:280–8. [Google Scholar] |
| 37. | Oommen AM, Nand K, Abraham VJ, George K, Jose VJ. Prevalence of statin use among high-risk patients in urban and rural Vellore, Tamil Nadu: A population-based cross-sectional study. Indian J Pharmacol 2017;49:201–4. [Google Scholar] |
| 38. | Choudhry NK, Dugani S, Shrank WH, Polinski JM, Stark CE, Gupta R, et al. Despite increased use and sales of statins in India, per capita prescription rates remain far below high-income countries. Health Aff (Millwood) 2014;33:273–82. [Google Scholar] |
| 39. | Bhatt DL, Steg PG, Miller M, Brinton EA, Jacobson TA, Ketchum SB, et al. Cardiovascular risk reduction with icosapent ethyl for hypertriglyceridemia. N Engl J Med 2019;380:11–22. [Google Scholar] |
Fulltext Views
2,666
PDF downloads
510


