Translate this page into:
Regional patterns in minimum diet diversity failure and associated factors among children aged 6–23 months in India
Correspondence to SUDESHNA ROY; sudeshna.jnu@gmail.com
[To cite: Gunnal G, Bagaria D, Roy S. Regional patterns in minimum diet diversity failure and associated factors among children aged 6–23 months in India. Natl Med J India 2024;37:181–90. DOI: 10.25259/NMJI_241_2023]
Abstract
Background
About 35% of the global child deaths and 11% of the total disease burden are due to inadequate nutrition. While in India, 1 in 3 children are underweight and stunted, and 1 in 5 children are wasted.
Methods
Using multivariate and descriptive statistical analysis, we examined the prevalence, determinants of minimum diet diversity failure (MDDF) and trends of MDDF across different regions of India among children aged 6–23 months. Dietary pattern in 8 food groups was also examined using the National Family and Health Survey (NFHS) data from 2005–06 to 2019–21.
Results
Overall, MDDF in India has decreased from 87.4% (2005–06) to 77.1% (2019–21). The central region (84.6%) reported the highest prevalence of MDDF in 2019–21. Children of illiterate and rural residing mothers with no mass media exposure, children of the first birth order and children not exposed to counselling and health check-ups at Anganwadi/Integrated Child Development Services (ICDS) centres, children with low birth weight and anaemic, and who belonged to a large family had greater likelihood for MDDF.
Conclusion
To tackle the high prevalence of MDDF, a holistic action is needed from the government, i.e. improved public distribution system (PDS), intensified Integrated Child Development Scheme (ICDS) programme, use of social media, and nutrition counselling through local self-governance.
INTRODUCTION
Collaborative efforts have played a major role in decreasing the prevalence of malnutrition globally.1 However, the proportion of children suffering from stunting (low height for age) and wasting (low weight for height) are still high.2 Approximately 22% of children under 5 years of age were stunted globally in 2020, and 54.4 million were wasted.3 Most of these children are in South Asian countries, especially India.4 Recent data show that stunting rates have declined in most of the countries in the region except Pakistan during 2000–15.5 According to the National Family and Health Survey (NFHS)-5 (2019–21), there has been a reduction in stunting (38.4% to 35.5%), wasting (21.0% to 19.3%) and prevalence of underweight (35.8% to 32.1%) compared to NFHS-4.6 However, approximately 1 in every 3 children is underweight and stunted, while 1 in every 5 children is wasted in India (NFHS-5).6 Dietary inadequacies, especially in the first 2 years of life, play a considerable role in this situation. Research shows that poor nutrition, diet frequency and quality result in long-term health implications for the child.7,8 These include increased risk of delayed motor and cognitive development, weak learning, low immunity, poor energy metabolism, memory, increased susceptibility to infections and mortality.9–11 Estimates by the WHO12 suggest that nutrition-related factors lead to nearly 35% of child deaths and contribute to 11% of the total disease burden globally.13
Refraining from the use of pre-lacteal feeds, ensuring exclusive breastfeeding till 6 months of age, adequate complementary feeding after 6 months, and use of appropriate infant and young child feeding (IYCF) practices14 are strategies that are essential for good child nutrition.15 To ensure that along with adequate quantity, an appropriate quality of diet is also being consumed, WHO has suggested the use of minimum diet diversity (MDD) as an indicator.16 Dietary diversity (DD) is an important indicator of food consumption highlighting the extent to which households have access to different food groups.17 According to MDD score, children in the age group 6–59 months must be given at least 5 of 8 food groups, which ensure that the child receives all the essential micronutrients required for growth.18 While DD is crucial, meal frequency is also a critical component of feeding practices to ensure that the child consumes the essential quantity of nutrients. When a child consumes less than 5 of 8 food groups then the child falls in the MDDF category. The child consuming 5 and above food groups is having an adequate diet.
Despite improvements since Independence, India has continued to drop in rank in the Hunger Index list, currently at 107th out of 121 countries.19,20 Numerous programmes (such as Poshan Abhiyaan, Integrated Child Development Scheme [ICDS], Public Distribution System [PDS] distributing ration to poor citizens) have been implemented by the government to improve the holistic nutritional status of citizens. A large-scale, data-based, recent study suggested that individual and contextual socioeconomic factors are associated with diversified dietary intake among Indian children.21 Additionally, factors such as maternal education and employment, access to nutrition and health-related information, and access to diverse food products may be associated with healthier overall dietary patterns, dietary quality, and adequate DD in low- and middle-income countries.8,22,23
It is thus evident that children need age-specific adequate nutrition of acceptable quality and quantity to prevent malnutrition. Children aged 6–23 months undergo a transition from breastfeeding to complementary feeding, and Indian children, mainly from low-income families, often experience growth failure due to a combination of frequent illness and an inadequate or imbalanced diet.24 Due to varied geographical and cultural diversities in India, it is crucial to understand the dietary consumption pattern of young children to ensure that minimum adequate diet is being consumed. Few studies have attempted to present the regional variations in MDD in Indian children under 2 years of age. Hence, we assessed the regional diversity and factors associated with MDDF and trends of MDDF in children under 2 years of age in India from NFHS-3 to NFHS-5.
METHODS
Study design and setting
We used NFHS datasets of 2005–06,25 2015–1626 and 2019–21.6 The NFHS is conducted under the guidance of the Ministry of Health and Family Welfare (MoHFW), Government of India (GoI) and provides cross-sectional data covering a nationally representative sample.
NFHS-4 forms the benchmark for developing the sampling design of NFHS-5 along with the need to provide estimates of population, health, and family welfare indicators at the district, state/Union Territory, and national levels with a reasonable level of precision. The 2011 Census of India formed the basis for primary sampling unit (PSU) selection. A stratified two-stage sampling design was implemented in rural and urban areas of 707 districts. The selection process for the rural sample involved a two-stage design, where villages served as the PSUs in the first stage. Villages were chosen with a probability proportional to their size, and in the second stage, 22 households were randomly selected from each PSU. Similarly, in urban areas, a two-stage sample design was employed. Census enumeration blocks (CEBs) were selected in the first stage, followed by a random selection of 22 households from each CEB in the second stage. In both urban and rural areas, the second stage involved selecting households after conducting a comprehensive mapping and listing operation in the initially chosen units.
Study population and sample size
The NFHS-3 survey was specifically designed to collect data at the state level across India’s 29 states and Union Territories during 2005–06. Similarly, the NFHS-4 and NFHS-5 surveys encompassed district-level estimates, covering all 36 states and Union Territories of India during 2015–16 and 2019–21, respectively. NFHS-3 uses a sample frame from the 2001 Census of India, whereas NFHS-4 and NFHS-5 use sampling frames of the 2011 Census of India. NFHS-3 covered 109 041 households with eligible women in the age group 15–49 years and eligible men in the age group 15–54 years, whereas NFHS-4 sampled 601 509 households and NFHS-5 covered 636 699 households from a subsample of PSUs/households in 30 456 PSUs. A total of 48 084 living children in the age group of 0–59 months were covered in NFHS-3, whereas in NFHS-4 and NFHS-5 a total of 244 508 and 221 263 children of the same age group were included, respectively. For the analysis, a total sample of 14 419, 74 078 and 64 710 children aged 6–23 months were included in the study from NFHS-3, NFHS-4 and NFHS-5, respectively. The published reports of NFHS-3, NFHS-4 and NFHS-5 give an elaborate description of the sampling procedures employed.25,26,6
Statistical analysis
Food groups. Descriptive and multivariable analyses have been carried out. For analysing the prevalence of DD and MDDF across the three NFHS rounds in India, the food items have been grouped into 8 food groups following the WHO’s IYCF guidelines: (i) breastmilk; (ii) ‘grains, roots, and tubers’ (comprising soup/clear broth OR bread, noodles, other grains OR fortified baby food OR potatoes, cassava, tubers); (iii) ‘legumes and nuts’ (comprising beans, peas, or lentils); (iv) ‘dairy products’ (comprising formula milk OR tinned powdered/fresh milk OR cheese, yogurt, other milk products OR yogurt); (v) ‘flesh foods’ (comprising liver, heart, other organ meat OR fish, shell-fish OR chicken, duck, or other birds); (vi) ‘eggs’ (comprising eggs); (vii) ‘vitamin A-rich fruits and vegetables’ (comprising pumpkin, carrots, squash OR dark green leafy vegetables OR mangoes, papayas, vitamin A fruits); and (viii) ‘other fruits and vegetables’ (comprising any other fruits). The respondents (mother, primary caregiver) were asked about the food items their child consumed within the 24-hour recall period. The prevalence of 8 food groups is shown across different regions of India from 2005–06 to 2019–21 along with the 95% confidence interval.
MDDF prevalence. The prevalence of MDDF was estimated across the states/Union Territories and districts of India for the latest NFHS-5 round. The estimated prevalence of MDDF across 28 states, 8 Union Territories and, 707 districts of India was mapped using Datawrapper software. The cross-sectional data (NFHS-3 to NFHS-5) on the prevalence of MDDF across the six regions has been represented graphically.
To understand the factors associated with MDDF among children aged 6–23 months across the different regions (north, central, east, northeast, west and south) of India, a multivariable binary logistic regression model was evolved. Before running the logistic regression, the multicollinearity of the variable was checked using variance inflammation factor (VIF) and those having low means VIF <5, which below those variables only are considered for logistic regression. Women’s individual weight has been used. The statistical software Stata Version 14 has been used for data analysis. The dependent variable MDDF prevalence is binary, where 0 denotes having an adequate diet and 1 denotes having diet diversity failure.
Covariables. The covariables for examining factors associated with the prevalence of MDDF were categorized into five groups: child characteristics (age, gender, birth weight, birth order, anaemia status); maternal characteristics (age, education, age at first birth, mass media exposure, currently breastfeeding); household characteristics (religion, caste, wealth index, place of residence, family size); healthcare uptake characteristics (health check-up from the Anganwadi/ICDS centre, received counselling from the Anganwadi/ICDS worker or auxiliary nurse midwife [ANM], received food from the Anganwadi/ICDS centre in the last 12 months, mother and child protection [MCP] card possession, full ANC). These covariables were selected based on the literature review on factors influencing nutrition of children27–30 and, on the information, retrieved from the NFHS-5 dataset.
The birth weight of children ≤2.5 kg, irrespective of the mother’s gestational age, was categorized as low birth weight, and the rest were considered to be normal birth weight. Children not weighed at birth or whose birth weight was unknown form the other two categories. Only children aged 6–23 months were a part of this study. Children with haemoglobin (Hb) <11 g/dl were considered as anaemic.28 Children with severe, moderate and mild anaemia were classified as anaemic, and those with normal Hb were considered non-anaemic.
In NFHS-5, women were asked about their frequency of exposure (not at all, less than once a week, at least once a week, almost every day) to three types of mass media (newspaper/magazine, radio, television).29 Women with exposure to at least one of these three media forms were labelled as having some mass media exposure and the rest were classified under none. The women were asked whether they are currently breastfeeding or not. Children currently on breastfeeding and not on breastfeeding are classified as yes and no, respectively. The Demographic and Health Survey Programme30 developed a computational method which formed the basis of constructing the wealth index. The household level economic status is represented by a wealth index, which is constructed using household assets and durables.27
Anganwadis, under the ICDS programme, were established in 1975 as designated centres for mother and child health.31 Information on whether the child received any health check-ups or whether mothers received any counselling from the Anganwadi/ICDS worker or ANM in the last 12 months was noted. Furthermore, the frequency of food received from the Anganwadi/ICDS centres for children was also documented. Whether the child had MCP card was recorded in NFHS-5. Possession of MCP card from the Department of Health and Family Welfare, GoI implies that the child is registered with the nearest public healthcare facility and is monitored regularly by community healthcare workers. Mothers who completed at least four visits to the antenatal clinic (ANC), who received at least one tetanus injection, and consumed more than 100 iron and folic acid (IFA) tablets during pregnancy were considered to have received full ANC. In contrast, the rest were considered to not have full ANC.
RESULTS
Table I shows the prevalence of MDDF among children in the age group of 6–23 months across six regions of India by selected socioeconomic characteristics in 2019–21. The children in the younger age group, i.e. 6–11 months (86.6%) have the highest prevalence of MDDF relative to higher age groups, i.e. 12–17 months (74.6%) and 18–23 months (62%). The central region ranks the highest in MDDF among all regions across all three age groups of children. The prevalence of MDDF is lower in the northeast (59.7%), east (61.6%), and south (62%) regions for children aged 18–23 months. Nationally, MDDF is marginally higher among girls (77.3%) than boys (76.8%). Regionally, MDDF among both boys and girls is equally high in central (85.1%, 84%), western (82.1%, 82.8%), and northern (79.9%, 79.8%) parts of India. Central (90.6%) and northern (85.8%) regions had the highest share of MDDF among children currently not breastfeeding. MDDF was 76.9% among children with anaemia as against 75.7% among non-anaemic children (Table I). The prevalence of MDDF is lower among children with no anaemia than children suffering from anaemia, except for the north and central regions. The prevalence of MDDF is relatively higher among children born with low birth weight (79.5%) than children with normal birth weight (74.9%) overall in India. By birth order, the prevalence of MDDF increased with the rising birth order of the children; birth order two (74.8%), three (78.8%) and four and above (79.7%).
| Characteristic | North | Central | East | Northeast | West | South | Total | n |
|---|---|---|---|---|---|---|---|---|
| Age (in months) | ||||||||
| 6–11 | 88.64 | 91.77 | 81.70 | 84.75 | 89.94 | 83.55 | 86.63 | 21 541 |
| 12–17 | 77.02 | 81.90 | 67.30 | 68.31 | 81.83 | 66.29 | 74.60 | 22 438 |
| 18–23 | 74.18 | 80.34 | 61.59 | 59.73 | 75.09 | 62.01 | 69.72 | 20 731 |
| Gender | ||||||||
| Men | 79.93 | 85.06 | 69.55 | 71.37 | 82.09 | 70.54 | 76.84 | 33 464 |
| Women | 79.84 | 84.03 | 71.28 | 70.65 | 82.76 | 71.56 | 77.31 | 31 246 |
| Birth order | ||||||||
| 1 | 81.49 | 86.85 | 67.60 | 74.45 | 83.25 | 73.08 | 77.62 | 25 431 |
| 2 | 77.35 | 82.66 | 68.05 | 69.23 | 81.38 | 68.43 | 74.80 | 21 532 |
| 3 | 80.87 | 83.74 | 74.29 | 67.85 | 84.50 | 73.10 | 78.80 | 9825 |
| 4+ | 80.55 | 83.96 | 78.37 | 67.47 | 79.00 | 68.52 | 79.72 | 7922 |
| Age of mother (years) | ||||||||
| 15–24 | 81.99 | 85.75 | 70.84 | 75.24 | 84.12 | 73.67 | 77.98 | 26 317 |
| 25–34 | 78.87 | 83.86 | 69.86 | 69.24 | 81.50 | 69.89 | 76.63 | 34 073 |
| 35–49 | 76.67 | 83.19 | 70.20 | 63.07 | 77.19 | 62.03 | 74.01 | 4320 |
| Education of mother | ||||||||
| No education | 81.82 | 84.90 | 78.43 | 71.66 | 84.14 | 75.82 | 81.00 | 12 506 |
| Primary | 81.90 | 84.72 | 70.25 | 70.52 | 81.87 | 77.43 | 78.25 | 7620 |
| Secondary | 79.94 | 84.89 | 66.81 | 71.48 | 82.04 | 71.21 | 76.15 | 34 577 |
| Higher | 76.82 | 82.96 | 66.32 | 67.43 | 82.99 | 68.57 | 74.87 | 10 007 |
| Age at first birth (years) | ||||||||
| <18 | 77.96 | 83.94 | 70.55 | 72.52 | 83.25 | 73.44 | 75.30 | 6078 |
| 18–21 | 81.12 | 84.62 | 71.77 | 73.12 | 82.28 | 71.25 | 77.59 | 30 246 |
| >21 | 79.09 | 84.58 | 67.51 | 68.06 | 82.38 | 70.54 | 76.89 | 28 386 |
| Religion | ||||||||
| Hindu | 81.61 | 84.88 | 71.15 | 73.98 | 82.57 | 72.20 | 78.14 | 47 899 |
| Muslim | 73.87 | 82.89 | 67.41 | 74.71 | 80.83 | 66.29 | 73.56 | 9180 |
| Christian | 59.38 | 83.60 | 68.06 | 57.88 | 82.12 | 65.16 | 64.20 | 5060 |
| Other | 74.24 | 75.57 | 74.79 | 60.51 | 85.00 | 74.67 | 76.25 | 2571 |
| Caste | ||||||||
| Other | 77.38 | 85.26 | 64.57 | 73.02 | 82.27 | 67.72 | 75.68 | 10 712 |
| Schedule caste | 78.78 | 85.43 | 70.57 | 74.90 | 81.02 | 71.89 | 77.20 | 13 228 |
| Schedule tribe | 85.33 | 79.34 | 69.18 | 62.40 | 83.54 | 73.70 | 76.00 | 12 902 |
| Other backward class | 82.04 | 85.05 | 76.47 | 73.02 | 82.86 | 71.00 | 79.02 | 24 940 |
| Unknown/inconsistent response | 74.82 | 72.90 | 52.56 | 74.99 | 80.54 | 70.50 | 65.90 | 2928 |
| Wealth index | ||||||||
| Poorest | 85.44 | 84.56 | 73.45 | 72.79 | 84.89 | 77.94 | 78.17 | 16 984 |
| Poorer | 81.90 | 84.75 | 71.42 | 72.92 | 82.28 | 75.54 | 78.12 | 14 964 |
| Middle | 81.68 | 84.72 | 65.68 | 66.96 | 84.50 | 72.10 | 76.60 | 12 788 |
| Richer | 79.87 | 85.54 | 63.36 | 65.30 | 80.93 | 68.99 | 75.80 | 11 067 |
| Richest | 76.70 | 82.96 | 65.26 | 65.45 | 81.15 | 68.37 | 76.09 | 8907 |
| In the past 12 months had a health check-up from the Anganwadi/ICDS centre | ||||||||
| No | 82.14 | 86.12 | 79.38 | 70.45 | 84.74 | 71.77 | 80.74 | 22 333 |
| Yes | 78.28 | 83.81 | 63.90 | 71.38 | 81.19 | 70.81 | 75.09 | 42 022 |
| Unknown/inconsistent response | 76.60 | 92.54 | 67.87 | 77.21 | 70.57 | 64.92 | 78.48 | 355 |
| In the past 12 months received counselling from the Anganwadi/ICDS worker or ANM | ||||||||
| No | 81.21 | 86.44 | 76.38 | 72.30 | 84.37 | 70.79 | 79.64 | 32 613 |
| Yes | 77.97 | 83.05 | 62.31 | 68.37 | 80.14 | 71.14 | 74.44 | 32 018 |
| Unknown/inconsistent response | 83.48 | 91.42 | 57.70 | 71.22 | 100.00 | 100.00 | 79.67 | 7 9 |
| In the past 12 months received food from the Anganwadi/ICDS centre | ||||||||
| Not at all | 81.49 | 86.72 | 79.83 | 73.19 | 85.07 | 73.16 | 81.47 | 17 488 |
| Almost daily | 79.43 | 81.09 | 54.76 | 65.39 | 81.00 | 73.07 | 70.82 | 14 423 |
| At least once a week | 80.48 | 82.94 | 64.60 | 68.57 | 83.47 | 69.03 | 77.28 | 10 828 |
| At least once a month | 77.23 | 85.37 | 74.95 | 72.36 | 80.19 | 69.05 | 77.35 | 18 192 |
| Less often | 80.96 | 89.88 | 78.52 | 70.46 | 82.10 | 65.22 | 80.89 | 3658 |
| Unknown/inconsistent response | 94.68 | 91.09 | 73.68 | 43.66 | 100.00 | 67.86 | 80.22 | 121 |
| Place of residence | ||||||||
| Urban | 78.04 | 83.37 | 67.87 | 66.21 | 81.17 | 70.02 | 75.72 | 13 085 |
| Rural | 80.75 | 84.87 | 70.89 | 71.85 | 83.23 | 71.68 | 77.55 | 51 625 |
| Mass media exposure | ||||||||
| None | 82.78 | 86.27 | 75.83 | 75.18 | 84.88 | 71.00 | 80.36 | 18 700 |
| Some | 79.22 | 83.20 | 66.09 | 68.58 | 81.84 | 71.03 | 75.78 | 46 010 |
| Currently breastfeeding | ||||||||
| No | 85.85 | 90.58 | 80.21 | 64.45 | 83.93 | 75.19 | 82.60 | 9327 |
| Yes | 78.68 | 83.56 | 69.28 | 71.59 | 82.10 | 69.81 | 76.09 | 55 383 |
| Birth weight | ||||||||
| Normal weight (>2.5 kg) | 78.81 | 83.25 | 67.90 | 68.85 | 81.79 | 69.09 | 74.92 | 37 714 |
| Low birth weight (<2.5 kg) | 81.09 | 85.70 | 71.46 | 75.88 | 83.40 | 75.03 | 79.53 | 21 919 |
| Not weighed at birth | 81.08 | 86.46 | 79.50 | 72.65 | 85.13 | 72.60 | 81.67 | 4214 |
| Don’t know | 86.87 | 87.07 | 78.91 | 71.23 | 71.34 | 94.29 | 83.44 | 863 |
| Family size | ||||||||
| <4 | 79.36 | 84.39 | 68.40 | 74.63 | 81.78 | 70.53 | 75.07 | 5753 |
| 4–6 | 78.88 | 84.44 | 67.85 | 71.14 | 81.71 | 70.87 | 75.58 | 35 030 |
| >7 | 81.11 | 84.72 | 74.96 | 69.03 | 83.43 | 71.61 | 79.65 | 23 9 2 7 |
| Complete ANC | ||||||||
| No | 81.76 | 85.00 | 74.29 | 72.10 | 84.26 | 71.61 | 79.30 | 46 061 |
| Yes | 75.73 | 82.49 | 57.88 | 68.02 | 79.87 | 70.48 | 71.94 | 18 649 |
| Child anaemia status | ||||||||
| No | 81.88 | 85.37 | 68.61 | 68.42 | 77.81 | 69.79 | 75.66 | 12 838 |
| Yes | 78.96 | 84.13 | 70.48 | 72.02 | 82.77 | 71.18 | 76.94 | 46 420 |
| Unknown/inconsistent response | 82.83 | 85.71 | 74.11 | 69.43 | 86.55 | 72.89 | 80.66 | 5452 |
Source: National Family Health Survey (NFHS)-5 (2019–2021) ICDS Integrated Child Development Scheme ANM auxiliary nurse midwife ANC antenatal clinic
Maternal and family characteristics
The prevalence of MDDF decreased with increasing age and education level of the mothers. Children with younger mothers (15–24 years) had the highest prevalence (78%) of MDDF, which progressively decreased with increasing age of mothers. Children of illiterate mothers (81%) had the highest prevalence of MDDF, as against among children of mothers with primary (78.3%), secondary (76.2%) and higher (74.9%) education, respectively. For all age groups of mothers with first birth, the prevalence of MDDF was more than 82% in the west and central regions in India. At the India level, for children with mothers having no mass media exposure (80.4%), the prevalence of MDDF was higher than among mothers having some exposure (75.8%).
Children belonging to Hindu families in India (78.1%) had the highest MDDF, while the lowest was among Christians (64.2%). Among the caste groups in India, other backward classes (OBC) children (79%) report the highest MDDF, followed by scheduled castes (SC) (77.2%) and scheduled tribes (ST) (76%). SC children residing in the central region (85.4%) had the highest MDDF, while ST children living in the northeastern region (62.4%) recorded the lowest MDDF. The prevalence of MDDF was higher by approximately 2% among rural children (77.6%) relative to urban ones (75.7%). Nationally, the prevalence of MDDF varied with the size of the family as well, with higher MDDF among children belonging to family size seven and above (79.7%). Across the country, the prevalence of MDDF was highest among the poorest children (78.2%) and decreased with increasing wealth index.
Healthcare and nutrition services
Healthcare provision to the mothers and children from the Anganwadi/ICDS centres had a protective influence on MDDF. The children who had MCP cards, were found to have slightly lower prevalence of MDDF (77%) at the India level as against the ones who did not have MCP cards (79.3%). Moreover, the prevalence of MDDF is higher among children who received no health check-up (80.7%) and no counselling (79.6%) relative to the children who received health check-up (75.1%) and counselling (74.4%). All the regions have a similar pattern. The provision of food from Anganwadi/ICDS centres is crucial in combating MDDF among children as is visible from the prevalence of MDDF, which was highest among children who received no food at all (81.5%). The lowest MDDF was reported from children who received food from Anganwadi/ICDS centres almost daily (70.8%), but children from the central region reported 81.1% MDDF. Regionally, children residing in the central, west and northern regions receiving no food, reported high prevalence of MDDF. Children of women who did not receive complete ANC had a higher MDDF (79.3%) relative to those whose mothers received complete ANC (71.9%). The difference between the two groups is stark in the eastern region where a higher proportion of children with incomplete ANC (74.3%) suffer from MDDF as against the children with complete ANC (57.9%).
Food group-based variation
The trend of DD and MDDF among children aged 6–23 months by consumption of food items within 8 food groups was computed. The consumption of breastmilk reduced from 87.13% (95% CI 86.59%–87.64%) in NHFS-3 (2005–06) to 84.92% (95% CI 84.64%–85.19%) in NFHS-5 (2019–21; Table II). Overall, among the 8 food groups, keeping aside breastmilk, in all three NFHS rounds, the share of grains, roots and tubers was the highest. The share of this food group, though has reduced over the years but was 78.55% (95% CI 77.00%–79.18%) in 2005–06, and 65.62% (95% CI 65.25%–65.98%) in 2019–21. The proportion of consumption of other essential food groups such as legumes and nuts has increased slightly from 13.80% (95% CI 13.26%–14.34%) during NFHS-3 to 17.34% (95% CI 17.14%– 17.42%) in NFHS-5. Further, the share of dairy products saw a marginal decline from 53.9% in 2005–06 to 52.4% in 2019–21. The consumption of eggs has registered an impressive rise; from 5.15% (95% CI 4.81%–5.5%) in 2005–06, it jumped up to 17.39% (95% CI 17.1%–17.68%) in 2019–21. Consumption of vitamin A-rich fruits and vegetables increased by 7.3 percentage points, whereas fruits and vegetables consumption increased by 13 percentage points over the same time. For flesh foods, the consumption increased by 4 percentage points.
| Food group | NFHS-3 | NFHS-4 | NFHS-5 | ||||||
|---|---|---|---|---|---|---|---|---|---|
| (95% CI) | (95% CI) | (95% CI) | |||||||
| NFHS-3 | Lower | Upper | NFHS-4 | Lower | Upper | NFHS-5 | Lower | Upper | |
| Breastmilk | 87.13 | 86.59 | 87.64 | 84.45 | 84.18 | 84.71 | 84.92 | 84.64 | 85.19 |
| Grains, roots and tubers | 78.55 | 77.90 | 79.18 | 68.72 | 68.37 | 69.05 | 65.62 | 65.25 | 65.98 |
| Legumes and nuts | 13.80 | 13.26 | 14.34 | 13.26 | 13.01 | 13.51 | 17.34 | 17.14 | 17.42 |
| Dairy products | 53.91 | 53.12 | 54.68 | 50.52 | 50.15 | 50.88 | 52.39 | 52.00 | 52.77 |
| Flesh foods | 7.50 | 7.09 | 7.92 | 9.95 | 9.73 | 10.17 | 11.50 | 11.26 | 11.75 |
| Eggs | 5.15 | 4.81 | 5.50 | 14.38 | 14.12 | 14.63 | 17.39 | 17.10 | 17.68 |
| Vitamin A-rich fruits or vegetables | 33.27 | 32.53 | 34.01 | 39.38 | 39.02 | 39.74 | 40.63 | 40.25 | 41.01 |
| Other fruits and vegetables | 14.95 | 14.40 | 15.52 | 23.84 | 23.52 | 24.14 | 27.86 | 27.51 | 28.20 |
Source: National Family Health Survey (NFHS)-3 (2005–06), NFHS-4 (2015–16), NFHS-5 (2019–21)
State-wise variation of MDDF
Figure 1 depicts the state-wise variation in the prevalence of MDDF. Eight states, mainly in the north, central and western parts of India had more than 80% prevalence of MDDF. Uttar Pradesh (86.1%), Rajasthan (85.1%), Gujarat (84%), Maharashtra (81.9%) and Madhya Pradesh (81.60%) are the top five ranking states. Eleven states, including Chhattisgarh (79.8%), Andhra Pradesh (79.8%) and Jharkhand (78.6%) report 70%–80% prevalence of MDDF. Fourteen states and Union Territories have 50%–70% prevalence of MDDF and lastly, only two states, i.e. Sikkim (42.6%) and Meghalaya (46.5%), had MDDF below 50%.

- Prevalence (%) of minimum diet diversity failure (MDDF) among children aged 6–23 months across the states of India, National Family Health Survey (NFHS)-5, 2019–21
The prevalence of MDDF among the children aged 6–23 months residing in 707 districts for 2019–21 is shown in Fig. 2; for another 21 districts, data were unavailable. The lowest prevalence was recorded in East Garo Hills district, Meghalaya (26.6%), Purba Bardhhaman district, West Bengal (31.1%), and Mahe district, Puducherry (33.1%), while the highest MDDF was observed in Datia, Madhya Pradesh (95.3%), Sindhudurg, Maharashtra (95.1%) and Palghar, Maharashtra (94.8%). Forty-three districts were in the highest MDDF prevalence category (above 90%), 249 districts in the 80%–90% category, 193 districts in the 70%–80% category, and 127 districts in the 60%– 70% category. Only 95 districts primarily in the southern, eastern and northeastern and northern parts of India prevalence of MDDF below 60%. Thus, it is worrisome to find that 86.5% of the districts in the country have MDDF of 60% or more.
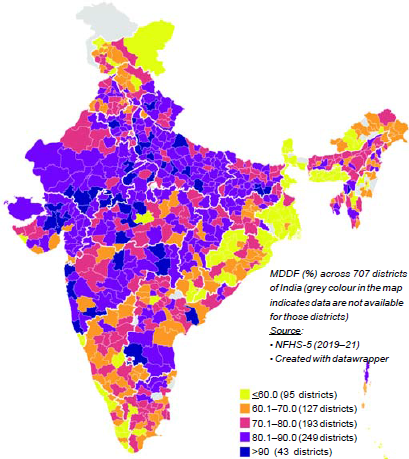
- Prevalence (%) of minimum diet diversity failure (MDDF) among children aged 6–23 months across districts of India, National Family Health Survey (NFHS)-5, 2019–21
Overall, at the country level, the trend of the prevalence of MDDF showed a decrease of 10.4% over three rounds, from 87.4% (2005–06) to 80.1% (2015–16) and 77.1% (2019–21; Fig. 3). In all three NFHS rounds, the central region had the highest prevalence of MDDF and the region registered the lowest decrease (by 7.2%), whereas the eastern region experienced the highest decline (by 14%) over 15 years. During NFHS-3, the southern region (80.9%) accounted for the lowest prevalence of MDDF, but the eastern region (70.4%) reported the lowest in NFHS-5. The western region also had a high prevalence of MDDF, much above the Indian average in NFHS-5.
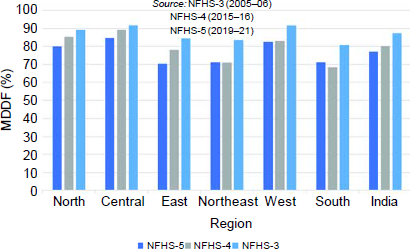
- Prevalence (%) of minimum diet diversity failure (MDDF) among children aged 6–23 months across regions of India, NFHS-3 to NFHS-5 National Family Health Survey
Determinants of MDDF
Table III presents the prevalence of MDDF by selected background characteristics and the effect measures (adjusted odds ratios) based on the multivariable logistic regression model. Logistic regression provides odds value which describes the deterministic and highly associated factors related to MDDF. A few variables that were used in the analysis have some ‘unknown/inconsistent response’ and were included in the study to avoid sample exclusion. This inclusion of this data did not lead to a different result from logistic regression analysis.
| Characteristic | North | Central | East | Northeast | West | South | Total |
|---|---|---|---|---|---|---|---|
| Age (in months) | |||||||
| 6–11 | 1 (referent) | 1 (referent) | 1 (referent) | 1 (referent) | 1 (referent) | 1 (referent) | 1 (referent) |
| 12–17 | 0.404‡ | 0.385‡ | 0.402‡ | 0.363‡ | 0.491‡ | 0.324‡ | 0.396‡ |
| 18–23 | 0.338‡ | 0.321‡ | 0.304‡ | 0.282‡ | 0.331‡ | 0.248‡ | 0.307‡ |
| Gender | |||||||
| Men | 1 (referent) | 1 (referent) | 1 (referent) | 1 (referent) | 1 (referent) | 1 (referent) | 1 (referent) |
| Women | 1.004 | 0.939 | 1.008 | 1.018 | 0.995 | 0.989 | 0.989 |
| Birth order | |||||||
| 1 | 1 (referent) | 1 (referent) | 1 (referent) | 1 (referent) | 1 (referent) | 1 (referent) | 1 (referent) |
| 2 | 0.753‡ | 0.763‡ | 0.892* | 0.757‡ | 0.814* | 0.812‡ | 0.819‡ |
| 3 | 0.856 | 0.806† | 1.077 | 0.738‡ | 1.116 | 0.936 | 0.955 |
| 4+ | 0.742† | 0.756* | 1.069 | 0.661‡ | 1.035 | 0.750 | 0.893† |
| Age of mother (years) | |||||||
| 15–24 | 1 (referent) | 1 (referent) | 1 (referent) | 1 (referent) | 1 (referent) | 1 (referent) | 1 (referent) |
| 25–34 | 0.973 | 0.957 | 0.925 | 1.076 | 0.835 | 0.913 | 0.924† |
| 35–49 | 0.955 | 0.937 | 0.796 | 1.130 | 0.906 | 0.748* | 0.822‡ |
| Education of mother | |||||||
| No education | 1 (referent) | 1 (referent) | 1 (referent) | 1 (referent) | 1 (referent) | 1 (referent) | 1 (referent) |
| Primary | 0.919 | 0.982 | 0.922 | 1.067 | 0.948 | 1.224 | 0.966 |
| Secondary | 0.885 | 0.991 | 0.876* | 1.109 | 0.845 | 0.853 | 0.897‡ |
| Higher | 0.737‡ | 0.826* | 0.939 | 1.176 | 0.791 | 0.729† | 0.800‡ |
| Age at first birth (years) | |||||||
| <18 | 1 (referent) | 1 (referent) | 1 (referent) | 1 (referent) | 1 (referent) | 1 (referent) | 1 (referent) |
| 18–21 | 1.255* | 0.996 | 1.033 | 0.967 | 0.994 | 1.006 | 1.099† |
| >21 | 1.198 | 0.953 | 0.988 | 0.871 | 1.175 | 0.957 | 1.100* |
| Religion | |||||||
| Hindu | 1 (referent) | 1 (referent) | 1 (referent) | 1 (referent) | 1 (referent) | 1 (referent) | 1 (referent) |
| Muslim | 0.441‡ | 0.774‡ | 0.854* | 1.128 | 0.889 | 0.777‡ | 0.719‡ |
| Christian | 0.303† | 0.904 | 0.999 | 0.682‡ | 0.553 | 0.674‡ | 0.484‡ |
| Other | 0.683‡ | 0.992 | 1.474* | 0.626‡ | 1.508 | 1.438 | 0.703‡ |
| Caste | |||||||
| Other | 1 (referent) | 1 (referent) | 1 (referent) | 1 (referent) | 1 (referent) | 1 (referent) | 1 (referent) |
| Schedule caste | 1.004 | 0.91 | 1.073 | 1.061 | 0.756* | 1.053 | 0.997 |
| Schedule tribe | 1.153 | 0.561‡ | 0.977 | 0.971 | 0.906 | 0.919 | 0.833‡ |
| Other backward class | 1.370‡ | 0.941 | 1.308‡ | 0.984 | 0.981 | 1.133 | 1.125‡ |
| Unknown/inconsistent response | 0.783* | 0.449‡ | 0.734† | 0.994 | 0.706* | 1.259 | 0.768‡ |
| Wealth index | |||||||
| Poorest | 1 (referent) | 1 (referent) | 1 (referent) | 1 (referent) | 1 (referent) | 1 (referent) | 1 (referent) |
| Poorer | 0.939 | 1.029 | 1.019 | 1.021 | 1.07 | 1.085 | 1.065* |
| Middle | 0.933 | 1.038 | 0.823† | 0.994 | 1.11 | 0.938 | 1.035 |
| Richer | 0.839 | 1.082 | 0.77† | 1.000 | 0.912 | 0.797 | 0.999 |
| Richest | 0.733† | 0.956 | 0.718* | 1.016 | 0.911 | 0.727* | 0.991 |
| In the past 12 months had a health check-up from the Anganwadi/ICDS centre | |||||||
| No | 1 (referent) | 1 (referent) | 1 (referent) | 1 (referent) | 1 (referent) | 1 (referent) | 1 (referent) |
| Yes | 0.751‡ | 1.124 | 0.656‡ | 1.206† | 1.073 | 0.954 | 0.968 |
| Unknown/inconsistent response | 0.48 | 1.695 | 0.756 | 1.491 | 0.641 | 0.93 | 1.044 |
| In the past 12 months received counselling from the Anganwadi/ICDS worker or ANM | |||||||
| No | 1 (referent) | 1 (referent) | 1 (referent) | 1 (referent) | 1 (referent) | 1 (referent) | 1 (referent) |
| Yes | 0.982 | 0.848† | 0.872* | 0.883 | 0.822* | 0.938 | 0.916‡ |
| Unknown/inconsistent response | 1.37 | 1.237 | 0.672 | 0.663 | 1.000 | 1.000 | 1.072 |
| In the past 12 months received food from the Anganwadi/ICDS centre | |||||||
| Not at all | 1 (referent) | 1 (referent) | 1 (referent) | 1 (referent) | 1 (referent) | 1 (referent) | 1 (referent) |
| Almost daily | 1.069 | 0.691‡ | 0.557‡ | 0.805* | 1.007 | 0.942 | 0.778‡ |
| At least once a week | 1.102 | 0.758† | 0.786* | 0.835* | 0.88 | 0.893 | 0.908* |
| At least once a month | 0.973 | 0.856 | 0.974 | 0.892 | 0.862 | 0.897 | 0.884‡ |
| Less often | 1.199 | 1.197 | 1.152 | 0.975 | 0.883 | 0.861 | 1.018 |
| Unknown/inconsistent response | 2.985 | 1.154 | 0.829 | 0.491 | 1.000 | 1.053 | 0.924 |
| Place of residence | |||||||
| Urban | 1 (referent) | 1 (referent) | 1 (referent) | 1 (referent) | 1 (referent) | 1 (referent) | 1 (referent) |
| Rural | 0.954 | 1.147* | 0.931 | 1.085 | 1.155 | 0.841† | 1.018 |
| Mass media exposure | |||||||
| None | 1 (referent) | 1 (referent) | 1 (referent) | 1 (referent) | 1 (referent) | 1 (referent) | 1 (referent) |
| Some | 0.870* | 0.818‡ | 0.809‡ | 0.851† | 0.802* | 1.002 | 0.809‡ |
| Currently breastfeeding | |||||||
| No | 1 (referent) | 1 (referent) | 1 (referent) | 1 (referent) | 1 (referent) | 1 (referent) | 1 (referent) |
| Yes | 0.506‡ | 0.469‡ | 0.505‡ | 0.89 | 0.501‡ | 0.598‡ | 0.573‡ |
| Birth weight | |||||||
| Normal weight (>2.5 kg) | 1 (referent) | 1 (referent) | 1 (referent) | 1 (referent) | 1 (referent) | 1 (referent) | 1 (referent) |
| Low birth weight (<2.5 kg) | 1.042 | 1.13† | 1.074 | 1.139* | 1.185* | 1.231‡ | 1.196‡ |
| Not weighed at birth | 1.021 | 1.224* | 1.065 | 1.265† | 0.928 | 0.896 | 1.145† |
| Don’t know | 1.292 | 1.408 | 1.09 | 1.066 | 0.649 | 8.711* | 1.32† |
| Family size | |||||||
| <4 | 1 (referent) | 1 (referent) | 1 (referent) | 1 (referent) | 1 (referent) | 1 (referent) | 1 (referent) |
| 4–6 | 0.955 | 1.134 | 1.025 | 0.969 | 0.914 | 1.119 | 1.069 |
| >=7 | 1.138 | 1.165 | 1.239† | 0.923 | 0.971† | 1.131 | 1.237‡ |
| Complete ANC | |||||||
| No | 1 (referent) | 1 (referent) | 1 (referent) | 1 (referent) | 1 (referent) | 1 (referent) | 1 (referent) |
| Yes | 0.858† | 0.843‡ | 0.732‡ | 0.766‡ | 0.773‡ | 0.904* | 0.764‡ |
| Child anaemia status | |||||||
| No | 1 (referent) | 1 (referent) | 1 (referent) | 1 (referent) | 1 (referent) | 1 (referent) | 1 (referent) |
| Yes | 0.884* | 0.933 | 1.065 | 1.155† | 1.045 | 1.037 | 1.058* |
| Unknown/inconsistent response | 1.007 | 0.999 | 1.144 | 1.010 | 1.27 | 1.009 | 1.138† |
MDDF is more prevalent among younger children compared to their elder counterparts. Compared to children aged 6–11 months, children of 12–17 months age were 60% (OR 0.396; 95% CI 0.376–0.416), and children of 18–23 months age were 69% (OR 0.307; 95% CI 0.292–0.323) less likely to have MDDF. Children of the first birth order had higher odds of having MDDF than children of the second and third birth order. MDDF was negatively associated with the level of education of the mother. In comparison to uneducated women, those with only primary level of education were 3% (OR 0.966; 95% CI 0.899– 1.038), women with secondary education were 10% (OR 0.897; 95% CI 0.846–0.951), and higher educated women were 20% (OR 0.800; 95% CI 0.740–0.866) less likely to report their children having MDDF. With the increase in maternal age, children were less likely to experience MDDF. The odds of MDDF increased with the rise in the age at the first birth of the mother. Relative to Hindu children, Muslim children were 28% (OR 0.719; 95% CI 0.678–0.763), and Christian children were 52% (OR 0.484; 95% CI 0.448–0.523) less likely to report having MDDF. Similarly, children who belonged to ‘other backward classes’ are 12% (OR 1.125; 95% CI 1.063–1.191) more likely to have MDDF than the ‘other’ caste group. The children with the richest and richer wealth index show little change in comparison to the poorest wealth index. Additionally, the children belonging to the poorer wealth quintile were 7% (OR 1.065; 95% CI 1.006–1.127), and children belonging to middle wealth index were 4% (OR 1.035; 95% CI 0.972–1.104) more likely to suffer MDDF than those belonging to the poorest wealth index. Healthcare exposure among mothers (health check-ups and counselling from the Anganwadi/ICDS centre and Anganwadi/ICDS worker or ANM), had a protective impact on children against MDDF. Children living in rural areas were 2% (OR 1.018; 95% CI 0.966–1.073) more likely to report MDDF than in urban areas. The odds of MDDF were significant, 19% (OR 0.809; 95% CI 0.770–0.851) less among children of mothers with some exposure to mass media compared to those having no exposure to mass media. The women currently breastfeeding children were 43% (OR 0.573; 95% CI 0.541–0.606) less likely to have MDDF than mothers who do not breastfeed their children. The children who were with low birth weight were 20% (OR 1.196; 95% CI 1.147–1.247) more likely to have MDDF than children having normal birth weight. MDDF is positively associated with family size; as family size increases, MDDF also increases. The children of a mother with full ANC had 24% (OR 0.764; 95% CI 0.733–0.796) lower likelihood to suffer from MDDF than the mother who did not undergo full ANC. The children who were anaemic were 6% (OR 1.058; 95% CI 1.009–1.109) more likely to have MDDF in comparison with children who did not have anaemia.
DISCUSSION
We examined the regional variation in MDDF in children under 2 years of age in India. It observes the factors affecting the regional variation in MDDF throughout India using national-level NFHS data. More than three-fourths of children experience MDDF, recording a slight improvement from NFHS-3 to NFHS-5. This still remains a concern as, though decreasing in proportion, the highest food group consumed by children of this age group is grains, roots and tubers. Yet, consumption of foods such as eggs, fruits and vegetables have increased considerably over the three surveys. Higher consumption of starch-based food groups, with a consecutively lower proportion of fruits, vegetables and animal products can lead to micronutrient deficiencies, subsequently causing undernutrition in children.32 Consistent with the existing literature, the present study observed that the prevalence of MDDF was higher in anaemic children than their non-anaemic counterparts.27,33,34 This may be due to a lack of high-protein quality, adequate content and bioavailability of micronutrients, macro-minerals, iron and essential fatty acids in the diets of children who have low diet diversity, increasing the likelihood of childhood anaemia.35
Upon further analysis, it was apparent that the dietary diversity of children improved with age, highest MDDF being observed in children 6–11 months of age.13,27 Previous reports have observed similar trends as this is the time period where a child is weaned off of breastmilk and complementary feeding is initiated. However, due to various cultural practices, lack of awareness and poor feeding practices, and other reasons, a delay occurs in the initiation of complementary feeding.36,37 Recent research on IYCF practices has emphasized the importance of variety in weaning food, with higher dietary diversity in complementary feeds linked with a lower prevalence of stunting, underweight and wasting.38,39,36 Similarly, girl children and children of higher birth order appeared to have a higher prevalence of MDDF.27
Likewise, family size, socioeconomic status of the family, religion and caste of the family also have an impact on the diet diversity of the child.34,40,41 We found that children from the lower socioeconomic quintiles, OBC and Hindu religion had the highest MDDF among their respective categories. Agrawal et al.42 did not find a significant correlation between wealth index and healthy food consumption. Conversely, they observed increased packaged food intake with increasing socioeconomic status.42
Children born to women in the age group of 15–24 years had higher prevalence of MDDF, which decreased with the increasing age of the mothers. Substantial evidence links these factors with the increased ability of the mother to understand the health education given, and take better dietary and health-related decisions for their child.43–45 Uptake of ANC services during pregnancy and benefits of Anganwadi centres (AWCs) after birth reduced the odds of experiencing MDDF for the children. Possession of MCP card, receiving complete ANC services during pregnancy,27 undergoing health check-ups and receiving counselling were also found to have a positive impact on diet diversity. Children who did not receive food from AWCs had the highest MDDF, compared to those who received food almost daily. Studies suggest that availing of these services ensures that the mother and child have received adequate healthcare and healthcare information on child care.27,34 Specifically, a higher number of ANC visits were found to improve the IYCF practices considerably and thus the diet diversity of the child.46
We also examined the regional variation in MDDF in India. Various studies have attempted to identify patterns in the prevalence of MDDF in the country.17,34 The eastern part of India has achieved the highest reduction in MDDF since NFHS-3, ranking lowest among all regions in NFHS-5. Contrastingly, central India has the highest MDDF. It is noteworthy that various parameters (maternal education and family size) that affect MDDF in other regions of the country do not show any difference in central India. Upon regional analysis, a clear picture of the impact of ANC services can be seen in eastern India, where around three-fourths of children with incomplete ANC suffered from MDDF as against less than 60% of the children with complete ANC. These regional variations may reflect the socioeconomic conditions, status of the healthcare system and cultural practices that exist in the region.47 The strength of ICDS services and their coverage is also an essential player in the nutritional status of a region. It is well-documented that in the areas where ICDS services are hard to reach, more children suffer from malnutrition and other preventable health problems.48
Conclusion and recommendations
Our study shows that the prevalence of MDDF remains high (above 75%) in India. There is a wide regional variation with children in central and northern Indian states suffering from severe MDDF. Augmented efforts in child-focused programmes such as (Poshan Abhiyan, National Nutrition Mission, detection of severe acute malnutrition [SAM] children, awareness raising and strengthening of nutrition counselling procedures and use of media in information education and communication [IEC] and outreach activities through Village/Urban Health and Sanitation and Nutrition Day [V/UHSND] and local self-governance mechanism) must be channellized towards pregnant women, those with high-risk pregnancy (HRP) and mothers with children less than 5 years of age as a priority. It would also undoubtedly require increasing national-level public expenditure on these programmes and recruitment of more human resources, with intensified attention paid to the states located in the central and northern parts of the country.
Conflicts of interest
None declared
References
- Levels and trends in child malnutrition: UNICEF/WHO/The World Bank Group joint child malnutrition estimates. 2012. Available at www.who.int/about/licensing/copyright_form/en/index.html (accessed on 15 Feb 2023).
- [Google Scholar]
- The burden of malnutrition. 2018. Available at https://globalnutritionreport.org/reports/global-nutrition-report-2018/burden-malnutrition/ (accessed on 15 Feb 2023).
- [Google Scholar]
- The state of food security and nutrition in the world 2022. 2022. Available at www.fao.org/3/cc0639en/online/sofi-2022/global-nutrition-targets-trends.html (accessed on 15 Feb 2023).
- [Google Scholar]
- Report on the roundtable on SDG 2 on Zero Hunger. 2021. UNESCAP, AsiaPacific Forum on Sustainable Development, Bangkok:Thailand. Available at www.unescap.org/sites/default/d8files/event-documents/SDG2%20Roundtable%20report%20APFSD8.pdf (accessed on 15 Feb 2023).
- [Google Scholar]
- Achieving sustainable development nutrition targets: The challenge for South Asia. J Global Health. 2020;10(1)
- [CrossRef] [Google Scholar]
- National Family Health Survey (NFHS-5), 2019-21. 2021 Available at www.rchiips.org/nfhs (accessed on 15 Feb 2023).
- [Google Scholar]
- Maternal and child undernutrition and overweight in low-income and middle-income countries. Lancet. 2013;382:427-51.
- [CrossRef] [Google Scholar]
- Urban household characteristics and dietary diversity: An analysis of food security in Accra, Ghana. Food Nutr Bull. 2016;37:202-18.
- [CrossRef] [Google Scholar]
- Iron deficiency in infancy and mother-child interaction at 5 years. J Dev Behav Paediatr. 2006;27:371-8.
- [CrossRef] [Google Scholar]
- Nutrition and brain development in early life. Nutr Rev. 2014;72:267-84.
- [CrossRef] [Google Scholar]
- Nutrition and the developing brain: Nutrient priorities and measurement. Am J Clin Nutr. 2007;85(Suppl):S614-S620.
- [CrossRef] [Google Scholar]
- Fifty-third World Health Assembly, agenda item 12.4 Infant and young child nutrition: follow-up. World Health Organization:Regional Office for the Western Pacific. 2000. Available at https://apps.who.int/iris/handle/10665/138475 (accessed on 15 Feb 2023).
- [Google Scholar]
- Dietary adequacy among young children in India: Improvement or stagnation? An Investigation from the National Family Health Survey. Food Nutr Bull. 2019;40:471-87.
- [CrossRef] [Google Scholar]
- Knowledge, attitude and practices regarding infant and young child feeding among lactating mothers from rural areas of Nanded, Maharashtra. Biomed Pharmacol J. 2020;13:833-41.
- [CrossRef] [Google Scholar]
- Indicators for assessing infant and young child feeding practices: Definitions and measurement methods. Geneva:WHO. 2021. Available at https://www.who.int/publications/i/item/9789240018389 (accessed on 15 Feb 2023).
- [Google Scholar]
- Levels and trends in child malnutrition: Key findings of the 2021 edition of the joint child malnutrition estimates. 2021. New York: United Nations Children's Fund. Available at www.who.int/publications/i/item/9789240025257 (accessed on 15 Feb 2023).
- [Google Scholar]
- Small area variations in dietary diversity among children in India: A multilevel analysis of 6-23-month-old children. Front Nutr. 2022;8:791509.
- [CrossRef] [Google Scholar]
- Developing and Validating Simple Indicators of Dietary Quality and Energy Intake of Infants and Young Children in Developing Countries: Summary of findings from analysis of 10 data sets. Food and Nutrition Technical Assistance Project (FANTA), Washington, D.C. 2006 August. Available at www.fantaproject.org/research/indicators-dietary-quality-intake-children (accessed on 15 Feb 2023).
- [Google Scholar]
- India. 2022. Available at www.globalhungerindex.org/india.html (accessed on 15 Feb 2023).
- [Google Scholar]
- India Ranks 107 on 2022 Global Hunger Index, behind Pakistan, Bangladesh and Nepal. 2022 October 16. Available at https://economictimes.indiatimes.com/news/india/level-of-hunger-in-india-serious-ranks-107-on-global-hunger-index-2022/articleshow/94876759.cms (accessed on 15 Feb 2023).
- [Google Scholar]
- Ecological and social patterns of child dietary diversity in India: A population-based study. Nutrition. 2018;53:77-84.
- [CrossRef] [Google Scholar]
- Socioeconomic determinants of household food security and women's dietary diversity in rural Bangladesh: A cross-sectional study. J Health Popul Nutr. 2015;33:2.
- [CrossRef] [Google Scholar]
- Socioeconomic determinants of dietary patterns in low-and middle-income countries: A systematic review. Am J Clin Nutr. 2014;100:1520-31.
- [CrossRef] [Google Scholar]
- Complementary feeding-Report of the global consultation. Summary of guiding principles for complementary feeding of the breastfed child. 2002 Geneva:World Health Organization. Available at http://apps.who.int/iris/handle/10665/42739 (accessed on 15 Feb 2023).
- [Google Scholar]
- National Family Health Survey (NFHS-3) 2007. Available at www.mohfw.nic.in (accessed on 15 Feb 2023).
- [Google Scholar]
- National Family Health Survey (NFHS-4) 2017. Available at www.rchiips.org/nfhs (accessed on 15 Feb 2023).
- [Google Scholar]
- Factors associated with minimum dietary diversity failure among Indian children. J Nutr Sci. 2022;11:e4.
- [CrossRef] [Google Scholar]
- Guidelines for control of iron deficiency anemia. National iron+ initiative. 2013. New Delhi:Ministry of Health and Family Welfare, Government of India. Available at www.nhm.gov.in/images/pdf/programmes/child-health/guidelines/Control-of-Iron-Deficiency-Anaemia.pdf (accessed on 15 Feb 2023).
- [Google Scholar]
- Mass media exposure and maternal healthcare utilization in South Asia. Soc Sci Med-Population Health. 2020;7:100614.
- [CrossRef] [Google Scholar]
- The DHS Wealth Index. 2004. DHS Comparative Reports No 6. Calverton, Maryland, USA:ORC Macro. Available at https://dhsprogram.com/publications/publication-cr6-comparative-reports.cfm (accessed on 15 Feb 2023).
- [Google Scholar]
- Role of India's Anganwadi centre in securing food and nutrition for mothers and children. J Agricultural Food Inform. 2022;16:174-82.
- [CrossRef] [Google Scholar]
- Fact sheets-Malnutrition. 2021 Available at www.who.int/news-room/fact-sheets/detail/malnutrition/ (accessed on 15 Feb 2023).
- [Google Scholar]
- Under-five anemia and its associated factors with dietary diversity, food security, stunted, and deworming in Ethiopia: Systematic review and meta-analysis. Syst Rev. 2020;9:31.
- [CrossRef] [Google Scholar]
- On behalf of the Global Maternal and Child Health Research Collaboration GloMACH. Understanding the enablers and barriers to appropriate infants and young child feeding practices in India: A systematic review. Nutrients. 2021;13:825.
- [CrossRef] [Google Scholar]
- Toward the prevention of childhood undernutrition: Diet diversity strategies using locally produced food can overcome gaps in nutrient supply. Food Nutr Bull. 2014;35:191-9.
- [CrossRef] [Google Scholar]
- Infant and young child feeding practices, sociodemographic factors and their association with nutritional status of children aged <3 years in India: Findings of the National Nutrition Monitoring Bureau survey, 2011-2012. Public Health Nutr. 2019;22:104-14.
- [CrossRef] [Google Scholar]
- The role of complementary feeding in India's high child malnutrition rates: Findings from a comprehensive analysis of NFHS IV (2015-2016) data. Food Secur. 2022;14:39-66.
- [CrossRef] [Google Scholar]
- Household food insecurity and children's dietary diversity and nutrition in India. Evidence from the comprehensive nutrition survey in Maharashtra. Matern Child Nutr. 2017;13(Suppl 2):e12447.
- [CrossRef] [Google Scholar]
- Diet quality and risk of stunting among infants and young children in low-and middle-income countries. Matern Child Nutr. 2017;13(Suppl 2):e12430.
- [CrossRef] [Google Scholar]
- Prevalence and factors associated with complementary feeding practices among children aged 6-23 months in India: A regional analysis. BMC Public Health. 2019;19:1034.
- [CrossRef] [Google Scholar]
- Systematic review of the design, implementation and effectiveness of mass media and nutrition education interventions for infant and young child feeding. Public Health Nutr. 2018;21:273-87.
- [CrossRef] [Google Scholar]
- Socio-economic patterning of food consumption and dietary diversity among Indian children: Evidence from NFHS-4. Eur J Clin Nutr. 2019;73:1361-72.
- [CrossRef] [Google Scholar]
- Maternal health literacy is associated with early childhood nutritional status in India. J Nutr. 2016;146:1402-10.
- [CrossRef] [Google Scholar]
- Determinants of infant and young child feeding practices by mothers in two rural districts of Sindh, Pakistan: A cross-sectional survey. Int Breastfeed J. 2017;12:40.
- [CrossRef] [Google Scholar]
- The association of parental education with childhood undernutrition in low-and middle-income countries: Comparing the role of paternal and maternal education. Int J Epidemiol. 2017;46:312-23.
- [CrossRef] [Google Scholar]
- Complementary feeding practices and associated factors among mothers of children aged 6-23 months in Ethiopia: Secondary data analysis of Ethiopian mini demographic and health survey 2019. Arch Public Health. 2021;79:205.
- [CrossRef] [Google Scholar]
- Socio-economic disparities in health system responsiveness in India. Health Policy Plann. 2013;28:197-205.
- [CrossRef] [Google Scholar]