Translate this page into:
Addiction habits in a rural cohort of injection drug users and effects on serum lipid profile: Analysis of a repeated measures study from an eastern state of India
Correspondence to SWEETY SUMAN JHA; swty.jha06@gmail.com; 37/3/1 Jaffarpur Road, 1st Lane Barrackpore, Kolkata 700122, West Bengal, India
[To cite: Lahiri A, Jha SS, Chakraborty A. Addiction habits in a rural cohort of injection drug users and effects on serum lipid profile: Analysis of a repeated measures study from an eastern state of India. Natl Med J India 2023;36:150–6. DOI: 10.25259/NMJI_1_21]
Abstract
Background
Injecting drug use (IDU) is associated with several cardiometabolic risks. We aimed to measure the independent effects of IDU behaviour and related factors on serum lipid profile among people who inject drugs (PWIDs).
Methods
We did a longitudinal study with six follow-up measurements at an interval of 2 months among 104 PWIDs from 11 selected hotspots under two blocks in West Bengal, India. Generalized estimating equations with robust standard errors analysed the effect of addiction habits on lipid profile parameters.
Results
The mean (SD) age of the participants was 27.6 (5.24) years, 36.5% married and 44.3% were unemployed at the time of recruitment. At the baseline, the mean (SD) body mass index (BMI) and fasting blood sugar (FBS) were 20.0 (1.82) kg/m2 and 112.0 (15.90) mg/dl, respectively. The mean duration of drug use was 2.5 (1.20) years. While 62.5% had normal triglyceride (TG), 14.4% had high total cholesterol (TC) and 69.2% had dyslipidaemia at the baseline. Adjusted for age, BMI, FBS and other addiction-related variables, models showed that longer duration of drug use (>3 years) resulted in higher levels of TG, higher TC-to-high-density lipoprotein ratio and dyslipidaemia. Tobacco use and high FBS level were also risk factors for dyslipidaemia.
Conclusions
Higher duration of IDU, tobacco use and higher FBS were associated with deranged lipid profile among PWIDs.
INTRODUCTION
People who inject drugs (PWIDs) are a critical population from the public health point of view since they belong to the most-at-risk population, particularly in the context of spread of the human immunodeficiency virus (HIV).1,2 Around 11 million people globally are known to be injecting drug users (IDUs), among whom around 1.3 million are currently living with HIV.3 India is known to have an estimated 1.1 million PWIDs, and the prevalence of HIV among the PWIDs is estimated at around 10%.1,4 HIV is a well-known and well-focused area while discussing about IDUs, but there are a number of other biological risk factors, e.g. different cardiovascular and metabolic factors associated, that threaten their lives.5,6
Studies from India and abroad on PWIDs focused mostly on different infectious disease outcomes, e.g. HIV, hepatitis C virus infection and their interaction.6–12 Cardiovascular complications are common among illicit drug users.13,14 Lipid profile is an important determinant of cardiovascular complications (e.g. ischaemic heart disease) of an individual.15 While researchers have rigorously worked on the psychosocial and behavioural associations of IDUs,16–19 there is a scarcity in the literature regarding the potential effects of IDU on alteration of lipid profile among the PWIDs. The effects in view of nutritional status and probable alteration in glucose homeostasis in individuals prove pertinent in establishing independent effect of injecting drugs on lipid metabolism.20
Drug abuse is commonly linked to urban settings, but it is spreading fast to rural parts of India as well and is often associated with sociopolitical factors, e.g. migration, international or national border regions.21,22 However, the rural population has been rarely studied focusing on IDU and the associated abnormality in lipid metabolism. We therefore studied the independent effects of IDU and related factors on serum lipid profile among the PWIDs in a rural setting.
METHODS
Study design and participants
A prospective follow-up study was conducted among adult (20–64 years) IDUs atten0ding 11 selected hotspots (of PWID) identified in two adjacent rural blocks of North 24 Parganas district, West Bengal, India. The participants, who were permanent residents of the rural areas, were examined at the beginning and at a 2-monthly interval for a follow-up period of 1 year. Those injecting recreational drugs for the past 1 year, attending a specific hotspot for the past 1 year and having completed at least one follow-up after the baseline were included in the final analysis. IDUs having diagnosed HIV, having relapse of drug use after undergoing rehabilitation, severely ill or suffering from diagnosed mental illness were excluded from the study to avoid a heterogeneous baseline risk. During follow-up if a person was committed to rehabilitation, became severely ill or HIV-positive, she/he was excluded from that point onwards. Eligible participants were clinically screened for compromised hepatic functions during recruitment and if found were excluded. Those with a deranged lipid profile at the baseline or at any subsequent follow-up were not excluded from the study. Following recruitment of the participants during July 2018–December 2018, the data collection for follow-ups was done till December 2019. Participants who did not give consent during any stage of the study were excluded from that follow-up.
Sampling and recruitment
The minimum required sample size was calculated based on the average values of the biochemical parameters as observed from an inclusive pilot sample. The minimum sample size required was calculated from the pilot data with the help of ‘glimpse’ guided study design calculator23,24 at 5% level of significance and 90% power of the study. The minimum required sample size was 84. On increasing the sample size by 25% for those lost to follow-up, the sample size was 105. During recruitment phase, hotspots for IDUs were identified with the help of the local health authority and community leaders. Depending on the sizes of each group (hotspots), the number of participants to be recruited from each group was calculated through probability proportional to size. Recruitment was done after obtaining informed consent. No incentives were provided for participation in the study.
Measurements and data collection
The data collection during recruitment was done through camp mode in the vicinity of the identified hotspots with the help of the local health authority. Support of the local health authority and trained workforce was used for sample collection during baseline and the subsequent follow-up. During follow-up visits, participants were approached individually by the researchers with the help of the local community and the health workers. Sociodemographic information regarding age, marital status, occupation and level of education was self-reported by the respondents and obtained only at baseline. The duration (years) of drug use, tobacco use and alcohol use was also self-reported at baseline. However, the frequency of self-reported addiction in the preceding 2 months was enquired on each follow-up visit including at baseline. The participants were subjected to measurements of height and weight by standardized stadiometer (IndoSurgicals® Height Measuring Scale) and bathroom-type weighing machine (MCP® Analog Mechanical Weighing Scale), respectively, following standard protocol. Body mass index (BMI) was calculated as: weight (in kilogram)/height (in metre square). BMI was estimated in each follow-up visit including at the baseline. Blood workup involved measurement of lipid profile, e.g. serum triglyceride (TG), total cholesterol (TC) and high-density lipoprotein (HDL), and fasting blood sugar (FBS) following standard guidelines.
Study variables and statistical analysis
The data collected were compiled in Epi Info™ 7 (Epi Info™, Centers for Disease Control and Prevention, Atlanta, USA) and analysed in STATA 14.2 software (Stata Corporation, College Station, Texas, USA). Nutritional status of the participants was classified based on the Asian BMI classification criteria.25 During each observation, FBS, HDL, TC and TG measured were dichotomized based on the standard cut-offs. FBS values >126 mg/dl were considered high (also considered probable diabetes). An HDL value of >60 mg/dl was considered protective while a lower value considered not protective, TC value of >200 mg/dl was taken as high and for TG, borderline (150–200 mg/dl) and high (>200 mg/dl) categories were clubbed together and considered as a higher risk.26 The TC–HDL ratio being an important indicator, which reflected the cumulative effects of low-density lipoprotein and HDL, was dichotomized as high (>3.5) and normal (<3.5).27 Dyslipidaemia was considered present if high values of either TG, TC or TC–HDL ratio were observed.28,29 Those who consumed any kind of tobacco product at least once daily were considered as chronic users while others were occasional users.
The baseline observations of age and duration of drug use were time-invariant predictors. However, frequency of drug use, tobacco use and alcohol use, FBS and nutritional status were time-varying predictors. The lipid profile parameters measured during each follow-up were time-dependent outcomes. The variables, both time varying and time invariant, were analysed with the help of population average model or more commonly known as marginal population model—generalized estimating equations (GEEs) to find out the effect of the predictors on the time-dependent outcome variables, with change in time.30,31 Robust standard errors were used to achieve an unbiased model fit, especially with respect to outliers. Effect size (epidemiological risk) was estimated in terms of odds ratio obtained, and the respective 95% confidence intervals (95% CIs) were reported. The p value was considered significant at <0.05. For multivariable analysis, the interaction between the different predictors was conceptually considered (based on biological plausibility) for inclusion in the model and was statistically evaluated. Four separate models were developed for (i) higher serum TG; (ii) higher TC; (iii) higher TC-HDL ratio; and (iv) development of dyslipidaemia. The models described in the present article were found to be statistically fit (χ2 p<0.001).
Ethical considerations
Permission was taken from the Institutional Ethics Committee. Following the administrative approvals, data collection was conducted maintaining confidentiality and on obtaining written consent from the respondents. Confidentiality was maintained, especially regarding HIV status of the patients. Although it was not a part of the study, still on ethics grounds the participants were encouraged to commit themselves to rehabilitation for quitting their addiction.
RESULTS
Background information
At baseline, 104 participants were recruited and examined (Fig. 1). All the participants were men. The mean (SD) age of the participants was 27.6 (5.24) years. The minimum age of the participants was 20 years. At baseline, 39.4% were aged 30 years or more. The proportion of married participants was 36.5%. Of the 104 participants, 9.5% were employed in the service sector while 44.3% were currently unemployed. The minimum level of education was completion of class VIII, and 20.6% had completed higher secondary level of education. While 18.8% were graduate, another 10.6% of the participants were reported to have dropped out of college at the time of recruitment. The difference in baseline characteristics of the participants at different points during follow-up (i.e. after attrition) was not statistically significant.

- Flowchart of participants at different points in the study
Different addictions among the participants
All the participants were consumers of alcohol and tobacco products. More than half of the participants at any stage in the study were chronic tobacco users or using alcohol in more than monthly frequency. The mean self-reported duration of IDU was 2.52 (1.20) years at baseline. Of the recruited participants, 30.8% were using drugs for a duration of at least 3 years, while only 2 participants were using for a period of <1 year. These 2 participants later committed themselves to rehabilitation to overcome the addiction and thus were exited from the study. The use of injecting drug was the newer addiction for all the participants. The frequencies of different addictions are given in Table I. Around 45.2%–50.0% of the participants as observed in different follow-up periods were injecting drugs on a daily basis for the past 2 months. At baseline, 14.1% of the PWIDs were using >2 drugs. The most commonly used substance was smack, i.e. impure heroin (66.4%), followed by benzodiazepines (33.3%) and pheniramine (13.5%). Nine respondents at the time of recruitment reported to be users of pure heroin which they referred to as brown sugar. Another 6 participants were users of anaesthetic cocktail.
| Frequency of addiction habits | Month of observation, n(%) | p value* | ||||||
|---|---|---|---|---|---|---|---|---|
| Baseline (n=104) |
2 (n=104) | 4 (n=102) | 6 (n=99) | 8 (n=99) | 10 (n=95) | 12 (n=94) | ||
| Injecting drug use | ||||||||
| Daily | 47 (45.19) | 52 (50.00) | 49 (48.04) | 48 (48.48) | 47 (47.47) | 44 (46.32) | 43 (45.74) | 0.610 |
| Once a week or more, but not daily | 50 (48.08) | 49 (47.12) | 51 (50.00) | 46 (46.46) | 45 (45.45) | 43 (45.26) | 41 (43.62) | |
| Less than once a week | 7 (6.73) | 3 (2.88) | 2 (1.96) | 5 (5.05) | 7 (7.07) | 8 (8.42) | 10 (10.64) | |
| Tobacco use | ||||||||
| Occasional smoker | 52 (50.00) | 50 (48.08) | 50 (49.02) | 49 (49.49) | 45 (45.45) | 43 (45.26) | 43 (45.74) | 0.986 |
| Chronic smoker | 52 (50.00) | 54 (51.92) | 52 (50.98) | 50 (50.51) | 54 (54.55) | 52 (54.74) | 51 (54.26) | |
| Alcohol use | ||||||||
| Less than once a month | 34 (32.69) | 30 (28.85) | 29 (28.43) | 29 (29.29) | 31 (31.31) | 28 (29.47) | 23 (24.47) | 0.999 |
| Once a month or more, but less than once a week | 55 (52.88) | 58 (55.77) | 57 (55.88) | 56 (56.57) | 53 (53.54) | 52 (54.74) | 54 (57.45) | |
| Once a week or more (including daily) | 15 (14.42) | 16 (15.38) | 16 (15.69) | 14 (14.14) | 15 (15.15) | 15 (15.79) | 17 (18.09) | |
Nutritional status and fasting blood sugar level
While no participants were found to be overweight at baseline, at the end of follow-up 10.6% were found to be overweight (Table II). While the proportion of underweight also increased from 26.9% at baseline to 27.7% at the end of 1-year follow-up. The trend was not statistically significant. At baseline, the mean BMI was 20.0 (1.82) kg/m2. At the end of 12 months, the mean BMI increased to 20.32 (1.94) kg/m2. The differences in mean BMI throughout the follow-up period were, however, statistically significant. Similarly, the trend in mean values of FBS was also statistically significant. At baseline, the mean FBS was 112.0 (15.9) mg/dl, which increased to 123.9 (19.10) mg/dl at the end of the follow-up period (Table II). This increasing trend is also understood from the proportion of participants having high FBS level between 15.4% and 23.2% during the study period. However, this trend of proportions was again not statistically significant.
| Item | Month of observation, n(%) | p value* | |||||||
|---|---|---|---|---|---|---|---|---|---|
| Baseline (n=104) |
2 (n=104) | 4 (n=102) | 6 (n=99) | 8 (n=99) | 10 (n=95) | 12 (n=94) | |||
| Nutritional status (BMI) | |||||||||
| Underweight | 28 (26.92) | 16 (15.38) | 24 (23.08) | 19 (19.19) | 20 (20.20) | 25 (26.32) | 26 (27.66) | 0.086 | |
| Normal | 76 (73.08) | 77 (74.04) | 68 (65.38) | 72 (72.73) | 73 (73.74) | 61 (64.21) | 59 (62.77) | ||
| Overweight | 0 (0.00) | 11 (10.58) | 10 (9.62) | 8 (8.08) | 6 (6.06) | 9 (9.47) | 10 (10.64) | ||
| Fasting blood sugar | |||||||||
| Normal (<126 mg/dl) | 86 (82.69) | 88 (84.62) | 83 (79.81) | 76 (76.77) | 78 (78.79) | 89 (93.68) | 83 (88.30) | 0.670 | |
| High (≥126 mg/dl) | 18 (17.31) | 16 (15.38) | 19 (18.27) | 23 (23.23) | 21 (21.21) | 15 (15.79) | 21 (22.34) | ||
| Lipid profile (mg/dl) | |||||||||
| Low HDL levels (<60) | 76 (73.07) | 71 (68.26) | 71 (69.61) | 72 (72.73) | 78 (78.79) | 82 (86.32) | 76 (80.85) | 0.565 | |
| High TG levels (≥150) | 39 (37.50) | 43 (41.35) | 47 (46.08) | 47 (47.47) | 46 (46.46) | 48 (50.53) | 51 (54.26) | 0.748 | |
| High TC levels (≥200) | 15 (14.42) | 14 (13.46) | 13 (12.74) | 16 (16.16) | 21 (21.21) | 24 (25.26) | 25 (26.59) | 0.134 | |
| Higher TC–HDL ratio (≥3.5) | 49 (47.12) | 48 (46.15) | 52 (50.98) | 45 (45.45) | 49 (49.49) | 46 (48.42) | 52 (55.32) | 0.947 | |
| Dyslipidaemia† | 72 (69.23) | 69 (66.35) | 7 73.53) | 75 (75.76) | 74 (74.75) | 78 (82.11) | 80 (85.11) | 0.707 | |
Lipid profile of the participants
The observed differences in mean values in repeated measures were found to be statistically significant for serum TG (p=0.001) and HDL (p=0.013) levels. While the trends for serum TC and TC–HDL ratio both were not observed to be statistically significant for repeated measures (p=0.7 and 0.2, respectively; Table II and Fig. 2). At baseline, the mean (SD) values of TC, TG and HDL were 180.88 (16.90), 147.63 (14.31) and 53.44 (9.41) mg/dl, respectively. The TC–HDL ratio at baseline was 3.45 (0.47). At the first follow-up, 13.5% of the participants had a high TC level. At the final follow-up, i.e. on completion of the 1-year follow-up period, 26.6% of the participants had developed high TC level. On the other hand, the proportion of participants having a protective level of HDL (>60 mg/dl) was 31.7% in the second month of follow-up, and at the end of the follow-up period, it was 19.2%. At the end of follow-up, 5.8% were found to have a high-risk level of HDL (<40 mg/dl), while no participant had such a level at baseline. At the first follow-up, 46.2% had a high TC–HDL ratio. At the end of the 1-year follow-up period, a higher ratio was observed among 52.3% of the participants. Throughout the follow-ups, the majority had normal serum TG. In the second month, 41.4% had a borderline value for serum TG while none had a level >200 mg/dl. At the end of follow-up, 49.0% had a borderline level. The observed trend in proportions was, however, not statistically significant. At baseline, 69.2% of the participants had dyslipidaemia. While the lowest proportion of dyslipidaemia among all the observations was at the first follow-up (66.4%), at the end of six months of follow-up the proportion of dyslipidaemia was highest (75.8%). The trend of dyslipidaemia was not statistically significant.
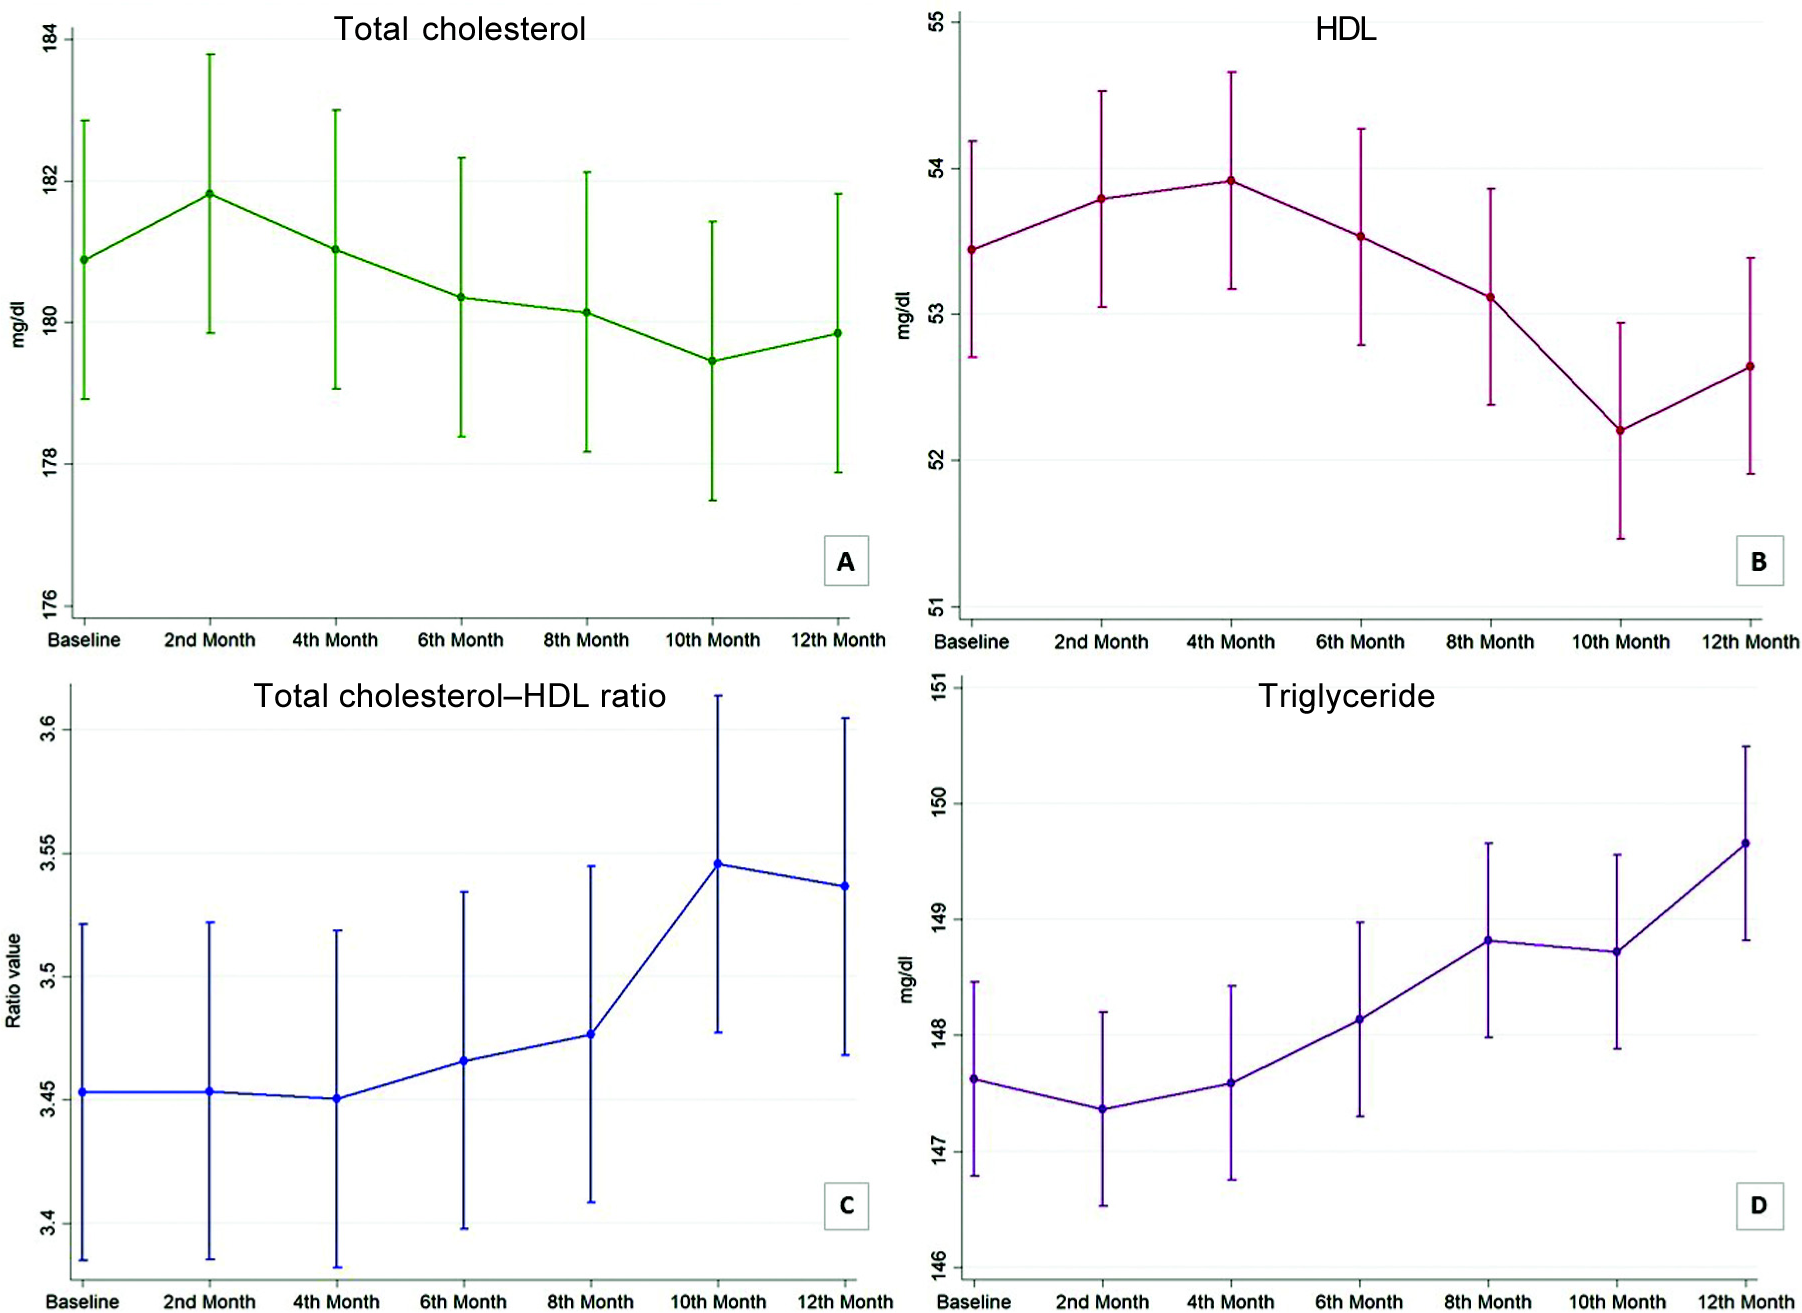
- Margin plot showing trend of different lipid profile parameters. (A) Total cholesterol; (B) high-density lipoprotein (HDL); (C) total cholesterol–high-density lipoprotein (HDL) ratio; (D) triglyceride
Predictors of abnormal lipid profile parameters
Model A shows the effect of different factors on developing a higher TG level. Models B and C show the predictors of higher TC level and higher TC–HDL ratio, respectively. The effect of the predictors on development of dyslipidaemia is shown in model D (Table III). Longer duration of drug use resulted in higher odds of developing higher levels of TG (2.41; 95% CI 1.18–4.96), TC–HDL ratio (2.34; 95% CI 1.26–4.37) and dyslipidaemia (3.38; 95% CI 1.60–7.13). However, the frequency of IDU did not have any statistically significant effect on the lipid profile of the participants. Chronic use of tobacco had an odds ratio of more than 1.5 in all the models predicting an adverse lipid profile outcome. However, a higher frequency of alcohol consumption was found to be protective against higher TC level. The effect of alcohol consumption was not statistically significant for development of dyslipidaemia. Having a normal BMI was protective against high TC level (odds ratio 0.48; 95% CI 0.35–0.67) compared to those overweight. Underweight resulted in an odds ratio of 2.52 (95% CI 1.18–5.38) for developing dyslipidaemia when compared to overweight. However, underweight was protective against higher TG and higher TC levels but did not have any statistically significant effect on HDL levels (observed through the TC–HDL ratio). A high FBS level increased serum TG levels and also produced 1.40 (95% CI 1.08–1.82) times risk of developing dyslipidaemia. A high TC value resulted in a higher TG level and vice versa.
| Biological and behavioural factors | Higher level of triglyceride | Higher level of total cholesterol | Higher total cholesterol-HDL ratio | Presence of dyslipidaemia | |||||||
|---|---|---|---|---|---|---|---|---|---|---|---|
| OR (95% CI) | p value | OR (95% CI) | p value | OR (95% CI) | p value | OR (95% CI) | p value | ||||
|
Age (years) Reference: <30 ≥30 |
0.54 (0.29-1.00) | 0.050 | 0.56 | (0.26-1.20) | 0.134 | 1.11 | (0.64-1.92) | 0.708 | 0.87 | (0.50-1.52) | 0.634 |
|
Years of injecting drug use Reference: <3 ≥3 |
2.41 (1.18-4.96) | 0.016 | 1.12 | (0.41-3.03) | 0.831 | 2.34 | (1.26-4.37) | 0.007 | 3.38 | (1.60-7.13) | 0.001 |
|
Frequency of injecting drug use Reference: Daily Less than once a day |
0.89 (0.62-1.28) | 0.542 | 0.66 | (0.34-1.28) | 0.220 | 1.05 | (0.64-1.72) | 0.853 | 1.25 | (0.71-2.18) | 0.441 |
|
Tobacco use Reference: Occasional Chronic |
2.44 (1.54-3.87) | <0.001 | 1.76 | (1.08-2.86) | 0.023 | 1.84 | (1.00-3.37) | 0.049 | 2.38 | (1.37-4.15) | 0.002 |
|
Alcohol consumption Reference: Less than once a month ≥ Once a month but <once a week ≥ Once a week |
0.72 (0.40-1.29) | 0.272 | 0.27 | (0.13-0.59) | 0.001 | 0.59 | (0.33-1.06) | 0.078 | 1.05 | (0.54-2.04) | 0.883 |
| 0.41 (0.16-1.06) | 0.067 | 0.20 | (0.06-0.71) | 0.013 | 0.44 | (0.23-0.84) | 0.013 | 0.54 | (0.24-1.24) | 0.147 | |
|
Nutritional status Reference: Overweight Normal |
0.85 (0.69-1.04) | 0.109 | 0.48 | (0.35-0.67) | <0.001 | 0.76 | (0.47-1.23) | 0.266 | 1.39 | (0.73-2.65) | 0.317 |
| Underweight | 0.72 (0.54-0.96) | 0.024 | 0.39 | (0.23-0.64) | <0.001 | 1.06 | (0.61-1.85) | 0.827 | 2.52 | (1.18-5.38) | 0.017 |
|
Fasting blood sugar level (m g/dl) Reference: Normal (<126) High (≥126) |
1.25 (1.09-1.45) | 0.002 | 0.75 | (0.49-1.14) | 0.180 | 1.05 | (0.88-1.25) | 0.575 | 1.40 | (1.08-1.82) | 0.012 |
|
Total cholesterol (mg/dl) Reference: <200 >200 |
1.76 (1.26-2.46) | 0.001 | |||||||||
|
Triglyceride (mg/dl) Reference: <150 ≥150 |
1.95 | (1.46-2.61) | <0.001 | 1.42 | (0.98-2.07) | 0.067 | |||||
All models adjusted for interaction of frequency of injecting drug use and its duration CI confidence interval HDL high-density lipoprotein OR odds ratio
DISCUSSION
Interpretation of the results in light of other studies
The age of the participants did not have any statistically significant effect, which may be attributed to the fact that compared to other similar studies, our cohort was younger.5,6,32,33 However, in comparison with research done in the Indian context, the younger age group of PWIDs is a relatable phenomenon.1,2,19,22 In a study at Chennai in India, the authors noted a comparatively higher HDL level among a PWID cohort with high burden of liver disease.6 However, in our study, the participants had a decreasing trend of HDL level, with a sharp dip in the penultimate observation. It has been established that IDU jeopardizes in vivo lipid metabolism.34 Our findings of the effect of long-term drug use are in consonance. Statistical interaction of duration and frequency was reported in a study from rural Virginia while describing the initiation pattern of PWIDs in a rural setting.35 Despite prevalent notions, increased frequency of drug use did not have any effect of lipid profile, while its interaction with duration of use was statistically significant and had an adverse effect. Based on the current findings, a dose–response relationship can be conceptualized. However, in their study, Vidot et al. have shown the ill-effect of repeated IDU on different cardiometabolic risk factors including dyslipidaemia.5
The protective effect of alcohol can be understood in light of the concept that it increases the transport rate of apolipoproteins A-I and A-II.36 Therefore, the HDL levels may increase, which explains the beneficial role observed in our study as well. On the other hand, Huang et al. in a community-based longitudinal study showed that moderate alcohol use was associated with a slower decrease in HDL level.37 In another study, Padro et al. showed that among overweight people, moderate intake of beer increased the good effects of HDL, facilitated cholesterol efflux and prevented lipid deposition in vessel walls.38 Therefore, the protective property of alcohol can be attributed to moderate quantity of consumption among our cohort.
Several studies have established the ill-effect of smoking tobacco on lipid metabolism.39–41 In consonance, we found a similar adverse effect attributed independently to tobacco use among the PWIDs. The higher effect size in our article indicates higher vulnerability, since the general health of the study population is already compromised due to IDU.
Khadke et al. in a study among Indians with diabetes reported a higher prevalence of dyslipidaemia in terms of triglyceridaemia and low HDL level. They also reported that FBS level was positively correlated with dyslipidaemia.42 Similarly, in our study, those who probably had diabetes, i.e. those having a high FBS level, had a higher chance of having developed high TG level. However, the same effect was not observed with cholesterol levels. Still, overall high FBG was statistically identified as a risk factor for dyslipidaemia.
What does this study add?
We observed that among PWIDs, there was an increasing trend of TG and TC–HDL ratio. The proportion with higher values also increased during the follow-up period but was not statistically significant for trend, though the fitted trend of the mean was statistically significant. This implies that with a longer follow-up, the higher (than cut-off) lipid profile proportions may become significant. Thus, the findings of lipid profile may indicate the tip of the iceberg. The duration of drug use and chronic tobacco use was found to unequivocally have an adverse impact on the lipid profile of the participants, though the change in trend of frequency of drug use before recruitment was not considered by us. A higher FBS was also identified as a risk factor for poorer lipid profile. However, frequent use of alcohol was found to be protective. This may be due to the fact that frequent alcohol use and frequency of drug use constitute an inverse relationship. Thus, the observed protection by alcohol may have resulted due to multivariate interactions. Normal BMI was found to be protective for TC level. However, a divergence was noted for the effect of underweight on TG and TC and dyslipidaemia. This may indicate the harmful effect of underweight on lowering HDL levels, thus increasing TC–HDL ratio more.
Strengths and limitations
Community-based longitudinal design and rural setting are important considerations. However, the self-reported practice of different addictions might have incurred recall and/or social desirability bias. The frequency-related responses by the PWIDs have been reported to have lower level of reliability.43 In fact, the trend of frequency of drug use since initiation was not considered in the study because of a probable differentiation bias in responses. Therefore, the models accounted for the interaction between frequency of drug use and the duration of follow-up at each follow-up and did not take into account the past trend of frequency. Our study had to take care of certain ethical issues during the course of data collection. The participants were advised for medical aid for abnormal blood reports. This might have influenced the observed trend of parameters studied. Apart from this, the results should be interpreted with caution for a probable healthy worker effect among the recruited participants. The work was done among a difficult to access yet homogeneous group of IDUs from selected rural areas. This undoubtedly adds to the strength. Robust estimation methods and use of population-averaged statistical models established the validity of the observed results.
Implications and conclusions
Our study brings out the evidence regarding the selected biochemical parameters among a rural cohort of PWIDs, a group of vulnerable and hard to reach population. The documented effects of frequency and duration of IDU in altering the lipid profile warrant these behavioural issues to be among the key areas of behaviour change communication and health education strategies to curb the growing menace of non-communicable diseases. As associated addictions, tobacco and alcohol use should be addressed as part of focused intervention schemes. In fact, programmes and rehabilitative measures can be tailored in a staged manner to address the associated addictive behaviours as addiction clusters. Being modifiable in nature, the effects clearly urge for early-age health education and motivational training against the addictive behaviours. The risks noted in the models can be used to prepare a priority intervention strategy to yield a better biochemical profile among the PWIDs. Detailed investigation into the causes of dyslipidaemia, e.g. various types of familial syndromes, any relationship with hypothyroidism, Cushing syndrome, etc., were beyond the scope of this study. These could be areas for further research along with effects of specific injectable drugs. The role of FBS and BMI in the noted trend of lipid profile indicated a biological yet modifiable effect, which should be considered as part of integrated therapy for rehabilitation of the PWIDs. Thus, our findings highlight the need of a package of services with behavioural and therapeutic interventions implemented simultaneously.
ACKNOWLEDGEMENTS
This study did not receive any institutional or external funds/grants. The expenses incurred were borne by the researchers. Assistance was provided by the Department of Community Medicine, Medical College Kolkata, for field-level mobility and laboratory investigations.
Conflicts of interest
None declared
References
- HIV Sentinel Surveillance 201415: A Technical Brief. Available at http://naco.gov.in/sites/default/files/HIV_Sentinel_Surveillance_report.pdf (accessed on 18 May 2020)
- [Google Scholar]
- Young people who inject drugs in India have high HIV incidence and behavioural risk: A crosssectional study. J Int AIDS Soc. 2019;22:e25287.
- [CrossRef] [PubMed] [Google Scholar]
- People who inject drugs. 2018. Geneva: WHO; Available at www.who.int/teams/global-hiv-hepatitis-and-stis-programmes/populations/people-who-inject-drugs (accessed on 18 May 2020)
- [Google Scholar]
- Injecting drug use in India and the need for policy and program change. Int J Drug Policy. 2016;37:115-16.
- [CrossRef] [PubMed] [Google Scholar]
- Illicit drug use and cardiometabolic disease risk: An analysis of 2005-2008 National Health and Nutrition Examination Survey data. Int J Clin Pract. 2013;67:1173-81.
- [CrossRef] [PubMed] [Google Scholar]
- Burden of liver disease among community-based people who inject drugs (PWID) in Chennai, India. PLoS One. 2016;11:e0147879.
- [CrossRef] [PubMed] [Google Scholar]
- Risk of hepatitis C infection among injection drug users in Mizoram, India. Indian J Med Res. 2008;128:640-6.
- [Google Scholar]
- Injection partners, HCV, and HIV status among rural persons who inject drugs in Puerto Rico. Subst Use Misuse. 2018;53:1128-38.
- [CrossRef] [PubMed] [Google Scholar]
- Epidemiology of hepatitis C virus infection and liver disease among injection drug users (IDUs) in Chennai, India. Indian J Med Res. 2010;132:706-14.
- [Google Scholar]
- HIV, hepatitis B and C among people who inject drugs: High prevalence of HIV and hepatitis C RNA positive infections observed in Delhi, India. BMC Public Health. 2015;15:726.
- [CrossRef] [PubMed] [Google Scholar]
- Liver disease in injection drug users with hepatitis C, with and without HIV coinfection. J Addict Dis. 2008;27:49-59.
- [CrossRef] [PubMed] [Google Scholar]
- Hepatitis and human immunodeficiency virus co-infection among injection drug users in Los Angeles county, California. J Addict Dis. 2006;25:25-32.
- [CrossRef] [PubMed] [Google Scholar]
- Cocaine use and cardiovascular complications. Med J Aust. 2002;177:260-2.
- [CrossRef] [PubMed] [Google Scholar]
- Cardiovascular complications of recreational drugs. BMJ. 2001;323:464-6.
- [CrossRef] [PubMed] [Google Scholar]
- Cardiovascular Diseases (CVDs) Available at www.who.int/news-room/fact-sheets/detail/cardiovascular-diseases-(cvds) (accessed on 18 May 2020)
- [Google Scholar]
- Extent of illicit drug use and dependence, and their contribution to the global burden of disease. Lancet. 2012;379:55-70.
- [CrossRef] [PubMed] [Google Scholar]
- Spatial distribution and characteristics of injecting drug users (IDU) in five northeastern states of India. BMC Public Health. 2011;11:64.
- [CrossRef] [PubMed] [Google Scholar]
- Injection drug use among children and adolescents in India: Ringing the alarm bells. Indian J Psychiatry. 2016;58:387-93.
- [CrossRef] [PubMed] [Google Scholar]
- Prevalence and predictors of self-reported risk behaviors among male injecting drug users. Indian J Public Health. 2019;63:114-18.
- [CrossRef] [PubMed] [Google Scholar]
- Links between nutrition, drug abuse, and the metabolic syndrome. Ann N Y Acad Sci. 2006;1074:303-14.
- [CrossRef] [PubMed] [Google Scholar]
- Injection drug use trajectories among migrant populations: A narrative review. Subst Use Misuse. 2018;53:1558-70.
- [CrossRef] [PubMed] [Google Scholar]
- India's growing problem of injecting drug misuse. BMJ. 2015;350:h397. Available at www.bmj.com/content/350/bmj.h397 (accessed on 18 May 2020)
- [CrossRef] [PubMed] [Google Scholar]
- GLIMMPSE: Online power computation for linear models with and without a baseline covariate. J Stat Softw. 2013;54:i10.
- [CrossRef] [PubMed] [Google Scholar]
- Selecting a sample size for studies with repeated measures. BMC Med Res Methodol. 2013;13:100.
- [CrossRef] [PubMed] [Google Scholar]
- Appropriate body-mass index for Asian populations and its implications for policy and intervention strategies. Lancet. 2004;363:157-63.
- [CrossRef] [PubMed] [Google Scholar]
- Indian Heart Association. Available at http://indianheartassociation.org/cholesterol-and-south-asians/ (accessed on 18 May 2020)
- [Google Scholar]
- Coronary risk prediction by the correlation of total cholesterol/high-density lipoprotein, triglyceride/high-density lipoprotein, low-density lipoprotein/high-density lipoprotein ratios, non-high-density lipoprotein, apolipoprotein-B, and high-sensitivity C-reactive protein with low-density lipoprotein in Indian patients under statin therapy. Heart India. 2019;7:63.
- [CrossRef] [Google Scholar]
- 2019 ACC/AHA Guideline on the primary prevention of cardiovascular disease: Executive summary: A report of the American College of Cardiology/American Heart Association Task Force on Clinical Practice Guidelines. Circulation. 2019;140:e563-e595.
- [CrossRef] [Google Scholar]
- Longitudinal data analysis for discrete and continuous outcomes. Biometrics. 1986;42:121-30.
- [CrossRef] [Google Scholar]
- An overview of methods for the analysis of longitudinal data. Stat Med. 1992;11:1825-39.
- [CrossRef] [PubMed] [Google Scholar]
- Coronary artery calcification, atherogenic lipid changes, and increased erythrocyte volume in black injection drug users infected with human immunodeficiency virus-1 treated with protease inhibitors. Am Heart J. 2002;144:642-8.
- [CrossRef] [PubMed] [Google Scholar]
- Cardiovascular disease among people with drug use disorders. Int J Public Health. 2015;60:659-68.
- [CrossRef] [PubMed] [Google Scholar]
- Changes in membrane enzymes and glycosphingolipids in lymphocytes from HIV-1-infected and noninfected intravenous drug users. J Acquir Immune Defic Syndr Hum Retrovirol. 1996;11:188-97.
- [CrossRef] [PubMed] [Google Scholar]
- Initiating persons into injection drug use in rural West Virginia, USA. Subst Use Misuse. 2020;55:337-44.
- [CrossRef] [PubMed] [Google Scholar]
- Alcohol consumption raises HDL cholesterol levels by increasing the transport rate of apolipoproteins A-I and A-II. Circulation. 2000;102:2347-52.
- [CrossRef] [PubMed] [Google Scholar]
- Longitudinal study of alcohol consumption and HDL concentrations: A community-based study. Am J Clin Nutr. 2017;105:905-12.
- [CrossRef] [PubMed] [Google Scholar]
- Moderate beer intake and cardiovascular health in overweight individuals. Nutrients. 2018;10:1237.
- [CrossRef] [PubMed] [Google Scholar]
- Cigarette smoking and its association with serum lipid/lipoprotein among Chinese nonagenarians/centenarians. Lipids Health Dis. 2012;11:94.
- [CrossRef] [PubMed] [Google Scholar]
- Association between cigarette smoking and metabolic syndrome: Response to Oh et al. Diabetes Care. 2006;29:482.
- [CrossRef] [PubMed] [Google Scholar]
- Cardiovascular disease risk factors in relation to smoking behaviour and history: A population-based cohort study. Open Heart. 2016;3:e000358.
- [CrossRef] [PubMed] [Google Scholar]
- Association of fasting plasma glucose and serum lipids in Type 2 diabetics. Indian J Pharm Sci. 2015;77:630-4.
- [CrossRef] [PubMed] [Google Scholar]
- Reliability of interview responses of injecting drug users. J Addict Dis. 1995;14:1-2.
- [CrossRef] [PubMed] [Google Scholar]